BI Market Share: 2026 Vendor Rankings and Strategic Shifts
The business intelligence market doesn't hand you a clean scoreboard. Vendor rankings shift constantly, driven by cloud migrations, AI integration, and changing buyer priorities. Understanding bi market share means reading between revenue figures to spot which vendors are gaining ground, which are losing momentum, and why those movements matter for your own strategic decisions. The landscape changed dramatically between 2023 and 2026, with several established players surrendering position while upstarts claimed territory in specific segments.
The Current BI Market Share Landscape
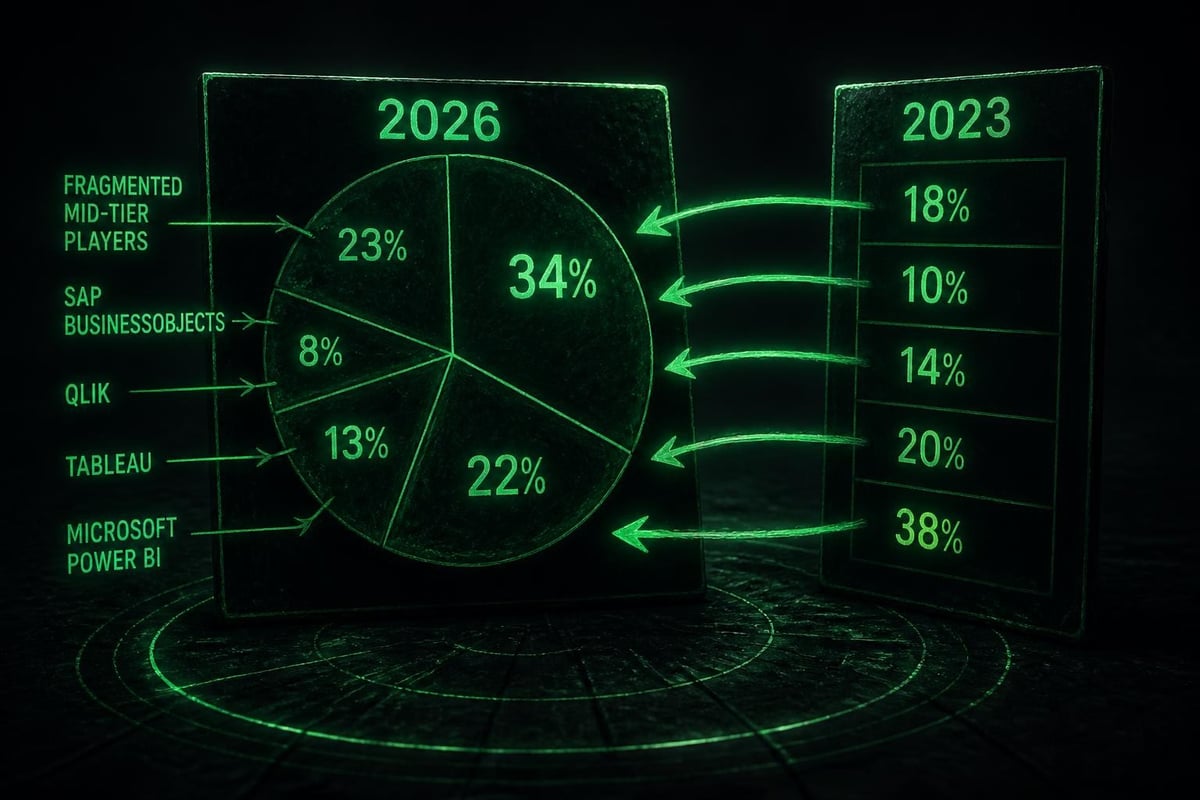
The global business intelligence software market reached $29.4 billion in 2026, according to Statista’s Business Intelligence Software Outlook. That figure represents 14.2% year-over-year growth, but the distribution across vendors tells a more complicated story than aggregate expansion suggests.
Microsoft Power BI holds the largest slice of bi market share at approximately 22.3%, a position it claimed in late 2024 and has defended through aggressive bundling with Microsoft 365 and Azure. Tableau (Salesforce) commands roughly 16.1%, down from 18.7% in 2023. The erosion isn't dramatic, but the direction matters. Qlik maintains 11.4%, while SAP BusinessObjects sits at 9.2%. The remaining vendors fragment into single-digit shares, with several clustered between 3-6%.
These percentages shift depending on whether you measure by revenue, user seats, or deployment instances. Statista’s vendor market-share data tracks revenue-based rankings, which favor enterprise deals over high-volume, low-cost deployments. A vendor with 50,000 small-business customers at $20/month ranks below one with 200 enterprise accounts at $500,000 annually, even if the former touches more users and generates more daily queries.
The Drivers Behind Market Share Movements
Three forces reshuffled bi market share between 2023 and 2026: cloud migration acceleration, embedded analytics adoption, and AI-powered automation.
Cloud migration hit critical mass in 2024. Enterprises that delayed through 2022-2023 finally committed, and that decision drove vendor selection. Legacy on-premise BI platforms lost ground to cloud-native or cloud-first alternatives. Microsoft's Azure integration gave Power BI an unfair advantage; companies already running Azure infrastructure faced minimal friction adding Power BI. SAP BusinessObjects and older IBM Cognos deployments bled accounts to vendors offering smoother cloud transitions.
Embedded analytics changed buying patterns. Instead of purchasing standalone BI platforms, companies increasingly demanded analytics capabilities built directly into their operational software (CRM, ERP, supply chain systems). This shift fragmented the market. SaaS vendors with adequate resources built proprietary BI rather than licensing third-party platforms. Salesforce embedding Tableau into its own products illustrates the pattern: it protected Tableau's enterprise footprint but capped expansion into other ecosystems.
AI automation arrived faster than most vendors anticipated. BARC’s BI Trend Monitor 2025 identified "AI-augmented analytics" as the top priority for 67% of surveyed organizations. Vendors that shipped natural-language querying, automated insight generation, and predictive modeling gained momentum. Those treating AI as a roadmap item rather than a shipping feature lost accounts to competitors who delivered immediately.
How Financial Services Reshaped BI Demand
Financial services institutions represent roughly 19% of total BI spend, making them the single largest vertical influence on bi market share. Their requirements differ sharply from other industries, and vendors that failed to adapt lost ground in this lucrative segment.
| Requirement |
Why It Matters |
Vendor Impact |
| Real-time data latency |
Trading, risk models, fraud detection demand sub-second refresh |
Penalized vendors relying on batch processing |
| Regulatory compliance |
SOX, MiFID II, GDPR audit trails required |
Favored platforms with built-in lineage tracking |
| Multi-source integration |
Banks use 200+ data sources on average |
Rewarded vendors with broad connector libraries |
| Role-based security |
Strict separation between analyst, trader, compliance roles |
Eliminated vendors with coarse access controls |
Deloitte’s analysis of data analytics in investment banking highlights how these institutions demand governance features most vendors treat as enterprise add-ons. The gap between standard BI platforms and financial-services-grade requirements created an opening for niche specialists. Some gained enough traction in this vertical to claim 2-3 points of overall bi market share despite narrow industry focus.
The regulatory dimension matters more than most vendors acknowledge. Financial institutions can't adopt BI platforms that lack comprehensive audit trails, version control for reports, and certification workflows. A platform might excel at visualization and query performance but remain undeployable in banking if it can't prove which data fed which executive dashboard on which date. Vendors that treated compliance as checkbox documentation rather than core architecture lost renewals when auditors flagged gaps.
The Embedded Analytics Dilemma
Embedded analytics undermined traditional bi market share calculations. When Salesforce, ServiceNow, and Workday build analytics directly into their platforms, do those capabilities count as BI market share? Most market researchers exclude them, but from a buyer's perspective, embedded analytics directly substitutes for standalone BI in many use cases.
This creates a measurement problem. A company running Salesforce with embedded Tableau dashboards technically contributes to Tableau's market share, but if Salesforce bundled those capabilities at no incremental cost, did Tableau actually capture that revenue? The accounting gets messy. Some organizations "use" three or four BI platforms simultaneously: one embedded in their CRM, another in their ERP, a third for finance, and a fourth for executive reporting. Asking "what's your BI platform?" produces answers that don't aggregate cleanly into market-share percentages.
The strategic implication: bi market share numbers understate fragmentation. The market looks more concentrated than it actually is because measurement methodologies ignore the 30-40% of analytics workloads now running on embedded platforms that don't appear in traditional BI vendor rankings.
Cloud-Native vs. Cloud-Adapted: Why Architecture Determines Share
The split between cloud-native and cloud-adapted architecture explains most of the bi market share gains and losses since 2023. Cloud-native platforms (built for cloud infrastructure from the start) outperformed cloud-adapted platforms (on-premise products retrofitted with cloud deployment options).
Looker (Google Cloud) exemplifies cloud-native advantages. Its data modeling layer assumes cloud storage, compute elasticity, and API-first integration. The platform scales horizontally without architectural gymnastics. Domo followed similar principles. Both gained share in segments where buyers prioritized cloud-first design over feature breadth.
Cloud-adapted platforms struggled with technical debt. Migrating a codebase designed for on-premise deployment introduces compromises. Query optimization techniques that worked brilliantly on local databases perform poorly against cloud data warehouses. Security models built for network perimeters don't translate cleanly to cloud identity management. Vendors that rushed cloud versions to market shipped products that technically ran in the cloud but didn't exploit cloud advantages.

This architectural divide created a trap for market leaders. Vendors with large on-premise install bases faced a choice: invest heavily in cloud-native rebuilds (abandoning existing customers on older versions) or incrementally adapt existing products (shipping inferior cloud experiences). Most chose incremental adaptation to protect revenue, which opened the door for upstarts with nothing to protect and everything to gain.
The Organizational Factors That Override Technical Merit
Technical superiority doesn't guarantee bi market share gains. Harvard Business Review’s research on data-driven decision-making identifies organizational and cultural factors that often matter more than platform capabilities. Companies select BI vendors based on:
- Existing technology relationships (Microsoft shops buy Power BI regardless of alternatives)
- Internal skill availability (platforms requiring scarce expertise lose to those matching current team capabilities)
- Executive sponsorship (a CTO's preference outweighs feature comparisons)
- Change fatigue (organizations recently completing other migrations avoid BI platform switches)
These non-technical factors entrench market leaders. Once a vendor achieves 15-20% market share, organizational inertia works in their favor. Buyers default to "safe" choices even when better alternatives exist. Displacing an incumbent requires not just superior technology but overwhelming superiority – enough to justify migration costs, retraining, and political battles with stakeholders invested in the status quo.
Competitive Intelligence Platforms and BI Market Share Data
Understanding bi market share movements matters for competitive intelligence teams tracking market dynamics. Platforms like BrandScout help organizations map competitive landscapes and identify strategic shifts before they become obvious. When a BI vendor's market share drops two percentage points over six quarters, that signal indicates vulnerability worth investigating.
BI vendor selection itself requires competitive analysis. A company choosing between Power BI, Tableau, and Qlik needs to evaluate not just current features but strategic direction, investment priorities, and ecosystem momentum. BrandScout's Competitive Analysis & Strategy offering runs frameworks like Porter's Five Forces and SWOT automatically, then generates attack and defense strategies grounded in real competitive data – the same analytical approach that helps decode why certain BI vendors gain ground while others stagnate.
Reading bi market share shifts means looking past headline percentages to understand why buyers chose one vendor over another. Was it price, features, integration, support, or something unrelated to the product itself? Research on BI visualization requirements shows that user experience factors – specifically, how easily non-technical users can build their own reports – increasingly drive vendor selection. A platform might have superior query optimization but lose deals because business users can't navigate its interface without SQL knowledge.
Regional Variations in BI Market Share
Global bi market share figures mask dramatic regional differences. North American rankings don't predict European or Asia-Pacific patterns. Microsoft Power BI dominates North America (26.4% share) but holds only 14.1% in Asia-Pacific, where local vendors and different buying preferences reshape the landscape.
Europe shows stronger preference for governance-heavy platforms. GDPR requirements and data-residency regulations favor vendors with robust data-lineage features and regional cloud infrastructure. SAP BusinessObjects maintains higher European market share (13.7%) than its global average (9.2%) because European enterprises already running SAP ERP find integrated BI adoption frictionless.
Asia-Pacific fragmentation reflects diverse market maturity. Japan's BI market skews toward local vendors (Wingarc, Cybozu) that Western share calculations ignore. China's market operates almost independently, with vendors like FineReport and Smartbi claiming meaningful share that never appears in global rankings. India shows rapid cloud adoption favoring low-cost, self-service platforms over enterprise suites.
Multinational companies operating across regions face a dilemma: deploy a single BI platform globally (simplifying governance but compromising regional fit) or allow regional variation (optimizing local needs but complicating central oversight). This decision influences which vendors gain share in different geographies.
The 2026-2028 Outlook for BI Market Share
Three developments will reshape bi market share through 2028: generative AI integration, data mesh architecture adoption, and vertical-specific platform growth.
Generative AI moves beyond natural-language querying into report generation, anomaly explanation, and automated insight delivery. Vendors shipping robust LLM integration will capture share from those treating AI as a future project. The gap between leaders and laggards on this dimension will widen rapidly because AI capabilities compound – each improvement enables the next, while platforms without foundation struggle to catch up.
Data mesh architecture challenges centralized BI assumptions. Instead of consolidating all data into a single warehouse for BI tools to query, data mesh distributes ownership to domain teams who publish data products. This shift favors BI platforms that integrate cleanly with federated data architectures over those requiring central data consolidation. Vendors invested in traditional ETL/ELT patterns face strategic risk if data mesh adoption accelerates.
Vertical-specific BI platforms will chip away at general-purpose vendor share. Healthcare BI platforms that understand FHIR standards, claims data, and clinical workflows outperform generic tools customized for healthcare. Similarly, retail, manufacturing, and logistics see specialized platforms gaining traction. This trend fragments the market, making bi market share leadership harder to defend because dominance in one vertical doesn't transfer to others.

What Market Share Actually Reveals
Bi market share percentages tell you which vendors won the most deals, but not why those deals closed or whether buyers made the right choice. A vendor can gain share by aggressive discounting, bundling with unrelated products, or superior sales execution despite mediocre technology. Conversely, smaller vendors with superior platforms sometimes lose deals to marketing budgets and brand recognition.
The strategic lesson: treat market share as one signal among many, not as validation. When evaluating BI vendors, investigate:
- Share trend direction (gaining or losing over 8-12 quarters)
- Segment-specific performance (enterprise vs. mid-market vs. small business)
- Customer retention rates (high churn despite market share growth signals dissatisfaction)
- Product investment (R&D spend as percentage of revenue indicates commitment)
- Ecosystem health (third-party integrations, community size, partner network)
A vendor with 8% market share but 95% retention and accelerating growth in your specific industry might be a better choice than the 20% market leader with 78% retention and stagnating innovation. Market share provides context, not answers. Understanding how to build effective battlecards helps sales teams translate competitive intelligence like BI market share into persuasive positioning that addresses real buyer concerns rather than abstract rankings.
The Acquisition Impact on BI Market Share
Acquisitions reshuffled bi market share more dramatically than organic growth over the past three years. Salesforce acquiring Tableau (completed 2019, but integration effects peaked 2024-2025) initially protected Tableau's share by providing Salesforce's distribution muscle, but then cannibalized growth as Salesforce pushed embedded analytics over standalone deployments.
Google's Looker acquisition (2019) followed a different pattern. Google invested in Looker's semantic modeling layer, positioning it as the analytics frontend for BigQuery. This strategy grew Looker's share within Google Cloud accounts but limited expansion into AWS and Azure environments. The trade-off: deeper integration with one cloud provider versus broader multi-cloud appeal.
Private equity consolidation reshaped the mid-market. PE firms acquired several BI vendors between 2023-2025, merged their customer bases, and eliminated redundant products. These moves consolidated fragmented mid-market share but often degraded product quality as engineering teams integrated disparate codebases. Some customers fled to pure-play vendors, redistributing share again.
The acquisition lesson: market share shifts lag strategy changes by 12-18 months. When a vendor gets acquired, their reported share often stays stable or even grows initially, before erosion sets in as the acquirer's strategic priorities reshape product roadmaps. Watching acquisition patterns helps predict future bi market share movements before they show up in revenue reports.
BI market share data reveals competitive movements, but translating those signals into strategic decisions requires deeper analysis than headline percentages provide. The vendors gaining ground in 2026 succeeded by aligning product architecture with buyer priorities (cloud-native design, AI integration, vertical specialization) while those losing share clung to approaches that worked in previous market conditions. BrandScout transforms scattered market signals like vendor rankings, technology shifts, and buyer preference changes into structured intelligence that clarifies competitive positioning and informs strategic execution.
Market Decision: Intelligence to Action in 2026
A market decision is the moment when scattered intelligence becomes committed action. It's the inflection point where analysis stops and execution begins. Most businesses struggle not because they lack data, but because they can't translate what they know into what they should do. The gap between awareness and action is where competitive advantage dies. In 2026, closing that gap requires more than dashboards and spreadsheets. It demands structured intelligence, proven frameworks, and the discipline to move from insight to implementation without second-guessing yourself into paralysis.
The Anatomy of a Market Decision
Every market decision carries three layers: the trigger, the analysis, and the commitment. The trigger is external – a competitor launches, pricing shifts, customer behavior changes. The analysis is your attempt to make sense of the signal. The commitment is the bet you place based on incomplete information.
Most companies confuse the trigger for the decision itself. A competitor raises funding, so you panic and discount. A feature ships, so you rush yours out half-baked. That's not decision-making; it's reaction. A true market decision requires separating signal from noise, understanding competitive intent, and choosing a strategic response that aligns with your position in the market.
What Separates Reaction from Strategy
Reaction is reflexive. Strategy is deliberate. When a competitor moves, your instinct might be to match them feature-for-feature or undercut on price. That instinct assumes their move was smart and that imitation is your best defense. Often, it's neither.
Strategic thinkers ask different questions:
- What does this move reveal about their constraints?
- What response would they least expect?
- What can we do that they structurally cannot?
A market decision rooted in strategy evaluates not just what happened, but why it happened and what it means for the battlefield ahead. It's the difference between matching a competitor's pricing because they cut first and holding firm because you understand their move signals desperation, not strength.

The Intelligence Layer: What You Need Before You Decide
You can't make a sound market decision without ground truth. That means knowing who your competitors are, what they're doing, and where the market is heading. Most businesses operate on fragments: a pricing page here, a review there, half-remembered conversations from a conference.
Fragmented intelligence produces fragmented decisions. When your picture of the competitive landscape is incomplete, every decision becomes a guess. You overprioritize visible threats and miss rising ones. You misread intent because you're working from outdated assumptions.
Building a reliable intelligence layer means three things:
- Complete competitor identification – not just the obvious players, but adjacent threats, rising challengers, and overlooked substitutes
- Continuous monitoring – markets move faster than quarterly reviews; your intelligence needs to update in real time
- Structured capture – raw signals need to flow into a system where they're categorized, connected, and ready to inform decisions
| Intelligence Gap |
Decision Impact |
Strategic Cost |
| Missing competitors |
Blindsided by new entrants |
Market share erosion |
| Stale data |
Responding to outdated threats |
Wasted resources |
| Scattered sources |
Inconsistent picture |
Paralysis or false confidence |
Platforms like Brandscout solve the intelligence-gathering problem by automating competitor discovery and tracking, so you're working from a complete, current view rather than guessing. When the Competitive Analysis & Strategy product runs proven frameworks – PESTEL, Porter's Five Forces, SWOT, Ansoff – it's operating on structured data, not anecdotes.
The Role of AI in Shortening the Intelligence Cycle
Generative AI changed the speed at which intelligence can be synthesized. What used to take a team of analysts weeks now happens in minutes. That doesn't mean AI makes the market decision for you. It means you can spend less time gathering and more time thinking.
AI surfaces patterns faster than humans can manually. It connects dots across disparate sources. It flags anomalies that might signal a competitor pivoting or a market shifting. But the final call – the market decision – still belongs to you. Recent research on AI-driven KPIs shows that the value isn't in automation alone; it's in how AI shortens the loop between data and strategic insight.
Frameworks: The Bridge Between Intelligence and Action
Frameworks don't make decisions for you. They clarify trade-offs so you can make decisions faster and with more confidence. A good framework exposes what you're betting on, what you're risking, and what you're giving up.
SWOT: Honest Inventory
SWOT – Strengths, Weaknesses, Opportunities, Threats – forces you to separate what you control from what you don't. Most teams treat it as a brainstorming exercise. That's a waste. SWOT is an inventory, not inspiration.
- Strengths and weaknesses are internal. They're the raw materials you have to work with.
- Opportunities and threats are external. They're the conditions of the market you're operating in.
A market decision grounded in SWOT asks: given our strengths and weaknesses, which opportunities can we realistically capture, and which threats can we actually mitigate? The rest is noise.
Porter's Five Forces: Understanding Competitive Pressure
Michael Porter's Five Forces framework maps the structural pressures on profitability in any market. It tells you where power sits and where margin gets squeezed. When you're making a market decision about pricing, positioning, or expansion, understanding these forces prevents you from betting against structural realities.
The five forces:
- Threat of new entrants
- Bargaining power of suppliers
- Bargaining power of buyers
- Threat of substitutes
- Competitive rivalry
If you're deciding whether to compete on price, Porter's forces tell you whether that's a sustainable move or a race to the bottom. If buyers have high bargaining power and substitutes are plentiful, cutting price just accelerates margin compression. A smarter market decision might be differentiation or vertical integration. Porter’s Five Forces clarifies the rules of competition before you commit resources.
Ansoff Matrix: Choosing the Growth Path
The Ansoff Matrix offers four growth strategies: market penetration, market development, product development, and diversification. Each carries different risk and resource requirements. A market decision about where to grow next should explicitly evaluate which quadrant you're playing in.
- Market penetration (existing product, existing market) is lowest risk but limited upside.
- Diversification (new product, new market) is highest risk but opens new revenue streams.
Most companies pick growth strategies based on instinct or imitation. Ansoff forces you to name the bet you're making and resource it appropriately.

The 14 Doctrines: Strategic Responses to Competitive Threats
Jorge A. Vasconcellos e Sá's competitive strategy framework offers 14 doctrines – 8 defensive, 6 offensive. These aren't invented tactics or borrowed metaphors. They're a fixed set of strategic responses grounded in competitive positioning. When you're making a market decision in response to a competitive threat, these doctrines clarify your options.
Defensive Doctrines
Defensive strategies protect position. They're appropriate when you're an incumbent under pressure or when a challenger is testing your boundaries.
- Position defense – fortify your core market
- Flanking defense – protect secondary markets
- Preemptive defense – strike before the threat materializes
- Counteroffensive defense – respond with precision to neutralize an attack
- Mobile defense – shift resources to stay ahead of changing conditions
- Contraction defense – consolidate around defensible positions
- Retreat – cede ground strategically to control timing and preserve resources
- Guerrilla defense – small, targeted moves that disrupt without full-scale engagement
Offensive Doctrines
Offensive strategies are for challengers and market entrants. They're appropriate when you're trying to take ground, not hold it.
- Frontal attack – direct, head-to-head competition
- Flanking attack – target underserved segments or geographies
- Encirclement – surround the competitor with multiple offerings
- Bypass attack – create a new category or leapfrog with innovation
- Guerrilla attack – unpredictable, resource-efficient strikes
- Alliance attack – partner to create combined strength
These doctrines don't predict the future. They clarify the logic behind a market decision. If you're choosing to hold the high ground, you're betting on brand equity and customer loyalty. If you're launching a flanking attack, you're betting the incumbent can't or won't follow you into a niche.
The Behavioral Layer: Why Smart People Make Bad Market Decisions
Even with perfect intelligence and clear frameworks, humans make irrational choices. Behavioral economics shows that bounded rationality – our tendency to simplify complex decisions – shapes how we process competitive information. We anchor on the first data point we see. We overweight recent events. We confuse confidence with competence.
A common trap: the availability heuristic. If a competitor just launched a high-profile feature, you overestimate its impact because it's top of mind. You rush a response, burning resources on something that doesn't actually move your position. A disciplined market decision separates signal from recency bias.
The Danger of Data Without Context
Harvard Business Review's coverage on pitfalls in data-driven decision-making highlights a critical risk: companies drown in metrics but starve for meaning. Tracking 47 KPIs doesn't make you smarter; it makes you slower. Every market decision should tie back to a small set of leading indicators that actually predict competitive outcomes.
Ask: what would change this decision? If the answer is "nothing," you're not using data to decide; you're using it to justify a choice you already made. That's confirmation bias dressed up as analysis.
Execution: The Market Decision After the Market Decision
A market decision isn't complete when you choose a strategy. It's complete when you execute it. Most strategies fail not because the analysis was wrong, but because execution was inconsistent, under-resourced, or abandoned halfway through.
Building the 90-Day Plan
A 90-day execution window is long enough to see results but short enough to maintain focus. Every market decision should decompose into:
- Week 1-4: Set conditions – align teams, allocate budget, establish metrics
- Week 5-8: First contact – launch, test, iterate based on early signals
- Week 9-12: Assess and adjust – measure against objectives, decide to double down or pivot
This cadence prevents two failure modes: moving too fast (launching before you're ready) and moving too slow (overthinking until the window closes).
Measuring What Matters
You need a tight feedback loop between your market decision and market reality. That means tracking metrics that reveal whether your chosen strategy is working.
| Strategy Type |
Leading Indicator |
Lagging Indicator |
| Market penetration |
Customer acquisition cost (CAC) trend |
Market share growth |
| Differentiation |
Win rate vs. named competitor |
Price premium sustained |
| Flanking |
Segment adoption rate |
Revenue from new segment |
| Preemptive |
Competitor response time |
Retained customer base |
If the leading indicators move in the wrong direction early, you have time to adjust. If you wait for lagging indicators, you've already lost the quarter.

When to Revisit a Market Decision
Markets evolve. Competitors adapt. A decision that was sound six months ago might be obsolete today. The question isn't whether to revisit decisions, but when and under what conditions.
Triggers for revisiting:
- Competitive countermove – they responded in a way you didn't anticipate
- Market shift – customer behavior, regulation, or technology changed the playing field
- Internal constraint – you can't resource the strategy as planned
Revisiting doesn't mean abandoning. It means updating your assumptions and recalculating. Sometimes the right call is to double down. Sometimes it's to pivot. The discipline is in evaluating without ego.
The Cost of Indecision
Indecision is a decision. When you delay a market decision waiting for perfect information, competitors move and conditions shift. The cost isn't just opportunity; it's momentum. Teams lose confidence. Customers sense hesitation. The market fills the vacuum you left.
Speed matters, but recklessness doesn't. The goal is to shorten the time between trigger and commitment without skipping the analysis. Structured intelligence and proven frameworks compress decision cycles because they eliminate the need to reinvent the process every time.
Building a Decision-Making System That Scales
One-off market decisions are tactical. A repeatable decision-making system is strategic. If every competitive move requires starting from scratch – gathering intel, debating frameworks, aligning stakeholders – you'll always be reactive.
A scalable system includes:
- Centralized intelligence – one source of truth for competitive data
- Standard frameworks – SWOT, Porter's, Ansoff applied consistently
- Clear ownership – who decides, who advises, who executes
- Regular cadence – weekly reviews, monthly deep dives, quarterly strategy resets
When intelligence flows into frameworks automatically, and frameworks produce action plans without manual synthesis, you've built a system that turns market signals into market decisions at the speed the market demands. Competitive intelligence platforms that integrate discovery, analysis, and planning solve the repetition problem: instead of rebuilding the process for every decision, you run the same workflow faster and more reliably.
The Role of Cross-Functional Alignment
A market decision made in isolation fails in execution. Sales, product, marketing, and finance need to understand the logic and commit to the plan. That doesn't mean consensus. It means clarity.
Alignment isn't agreement. It's shared understanding of the trade-offs and the bet. If product knows you're prioritizing speed over polish to preempt a competitor, they can resource accordingly. If marketing knows you're flanking into a new segment, they can shift messaging. Misalignment happens when the rationale behind the market decision stays locked in the C-suite.
Intelligence, Frameworks, Execution: The Loop That Compounds
Market decisions improve when you close the loop. Every decision generates data. Every execution reveals whether your assumptions were right. That new intelligence feeds the next decision, making it sharper.
The companies that dominate their markets in 2026 aren't the ones with the most data. They're the ones with the tightest loop between intelligence, analysis, and action. They make market decisions faster, with higher confidence, because they've built systems that learn.
The compounding effect of disciplined decision-making:
- Each decision refines your competitive model
- Each execution tests your understanding of the market
- Each result updates your intelligence and sharpens your frameworks
Over time, you're not just making better market decisions; you're making them faster. Speed and accuracy compound. Your competitors are still gathering intel when you're already three moves ahead.
A market decision is only as good as the intelligence behind it and the discipline to execute it. When you're ready to move from scattered signals to structured strategy, Brandscout gives you the competitive intelligence platform that closes the gap between what you know and what you do. Transform market signals into confident action, every time.
Consumer Intelligence Company: Build vs. Buy in 2026
Every decision you make about customers starts with a decision about intelligence. Whether you're launching a product, repositioning against a rival, or allocating budget across channels, you're either guessing or you're working from structured insight. A consumer intelligence company promises the latter: packaged systems, trained analysts, automated dashboards that turn messy customer signals into clarity. But the promise and the reality split fast. Some deliver exactly what you need. Others sell you a subscription to someone else's taxonomy, methodologies that fit their last ten clients better than your next move, and reports that arrive too late to change the plan. The question isn't whether consumer intelligence matters – it does, and more every quarter – it's whether outsourcing it accelerates you or just gives you a credible excuse when the strategy fails.
What a Consumer Intelligence Company Actually Does
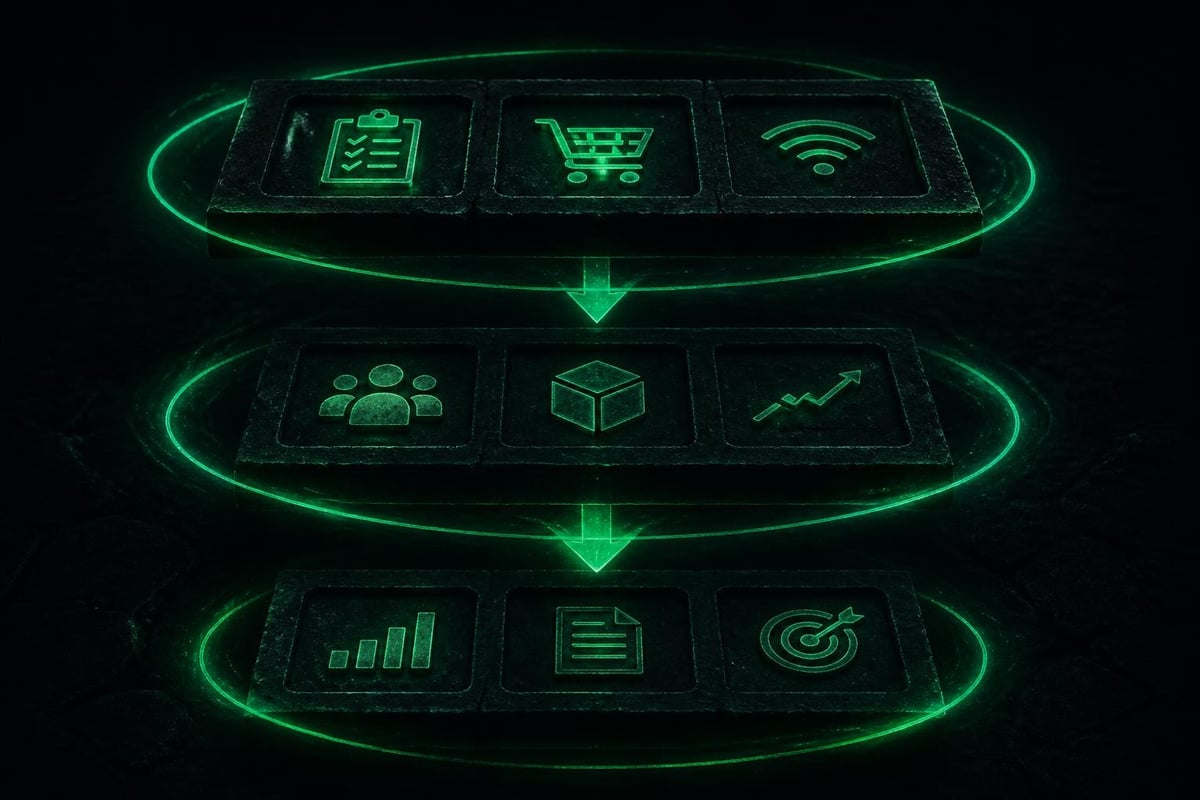
A consumer intelligence company collects, structures, and interprets signals about customer behavior, preferences, sentiment, and intent. It pulls data from transactions, surveys, social platforms, search behavior, reviews, support tickets, and third-party panels, then packages that into reports, dashboards, or ongoing feeds. The output is meant to answer questions like: Who is buying? Why now? What alternatives did they consider? What language do they use? Where are they headed next?
The work splits into three layers:
- Data acquisition: Licensing panel data, scraping public sentiment, running proprietary surveys, buying syndicated research, or instrumenting digital properties to capture first-party signals.
- Analysis and synthesis: Tagging, segmenting, modeling, and summarizing raw signals into trends, personas, journey maps, or predictive scores.
- Delivery and activation: Packaging insight into reports, live dashboards, API feeds, or embedded recommendations inside your CRM, ad platform, or product analytics stack.
Different providers specialize in different parts of this chain. Some are data brokers with light analysis. Others are consultancies that buy commodity data and add expensive interpretation. A few are platforms that let you run the analysis yourself but hand you better pipes and templates than you'd build in-house.
The Promise: Speed and Scale You Can't Match Internally
Hiring a consumer intelligence company makes sense when the alternative is slower and more expensive. If building an in-house consumer research function means six months of hiring, tooling, and trial-and-error, and the window to move is eight weeks, you buy the capability ready-made.
Scale is the other argument. A good provider already has partnerships with data sources you'd spend a year negotiating access to: panel providers, sentiment aggregators, transaction feeds, location data networks. ESOMAR’s Global Market Research 2024 report shows the global market research industry continuing its shift toward tech-enabled, always-on data streams rather than episodic studies – a shift that favors specialists with infrastructure already running.
The edge you're buying:
- Immediate access to broad, structured datasets (panel surveys, sentiment corpora, transactional proxies)
- Pre-built taxonomies and frameworks (segmentation schemes, journey templates, category benchmarks)
- Analysts trained in specific methodologies and verticals, so you're not teaching someone retail economics from scratch
- Continuous updates as consumer behavior shifts, instead of point-in-time snapshots that go stale
This works when your question fits their frame. If you're a CPG brand asking "How is Gen Z snacking behavior shifting?" and the provider already tracks that category, you get an answer this month instead of next year.
The Risk: Renting Someone Else's Strategy
The problem is fit. A consumer intelligence company builds systems to serve many clients, so it optimizes for breadth and repeatability, not the edge case that defines your competitive position. If your advantage depends on understanding a micro-segment, a behavioral nuance, or a geographic pocket that doesn't show up in their panel design, you're working from someone else's map.
Where outsourced intelligence breaks down:
| Risk |
Why It Happens |
What It Costs You |
| Generic segmentation |
Provider uses the same persona framework across 50 clients in your category |
You optimize for averages, miss the outlier segment where growth is hiding |
| Lagging indicators |
Surveys and panels capture stated preference and past behavior, not emerging intent |
You see the shift after competitors already moved |
| Methodological lock-in |
Switching providers means losing longitudinal comparability, so you're stuck even when the fit degrades |
Sunk cost keeps you paying for declining relevance |
| Attribution opacity |
You don't control how data was collected, cleaned, or weighted, so you can't audit quality or bias |
Decisions rest on a black box you can't interrogate when results don't match reality |
The worst version is when leadership treats the subscription as strategy. "We have a consumer intelligence company" becomes the answer to "How do we know?" – and nobody asks whether the insight is actually shaping decisions or just decorating slide decks.
Build vs. Buy: The Honest Calculus
Building in-house gives you control and specificity. You design the data collection to answer your exact questions. You own the methodology, the refresh cadence, the integration into your decision rhythm. You're not renting someone else's taxonomy.
You should build when:
- Your competitive edge depends on proprietary customer insight that a shared provider can't deliver
- You have the talent and budget to hire researchers, analysts, and engineers who can instrument, model, and operationalize the system
- The ongoing cost of subscription fees and consultancy retainers exceeds the loaded cost of an internal team over three years
- Speed-to-insight matters more than speed-to-start, and you can afford the six-to-twelve-month buildout
Forrester’s analysis of high-performing consumer insights teams highlights that the best functions blend internal research talent with selective vendor partnerships – they own the strategy and questions, rent the infrastructure and panel access.
You should buy when:
- You're entering a new category and need baseline intelligence fast, before committing to a full build
- The questions you're asking are standard enough that an off-the-shelf solution fits (category sizing, sentiment tracking, demographic profiling)
- You lack the budget or timeline to build, and the alternative is guessing
- The provider offers access to data sources you'd never negotiate on your own (proprietary panels, transaction feeds, sentiment corpora)
The middle path – platform-assisted build – is where most growth companies land. You use a platform that gives you the pipes (data connectors, dashboards, analysis templates) but lets you define the questions, the segments, the refresh logic. You're not building from zero, but you're not locked into someone else's doctrine either. BrandScout’s approach follows this model on the competitive-intelligence side: it automates discovery and applies proven strategy frameworks, but the analysis stays yours, grounded in your real market data rather than a syndicated feed.
Privacy, Compliance, and the Data-Sourcing Minefield
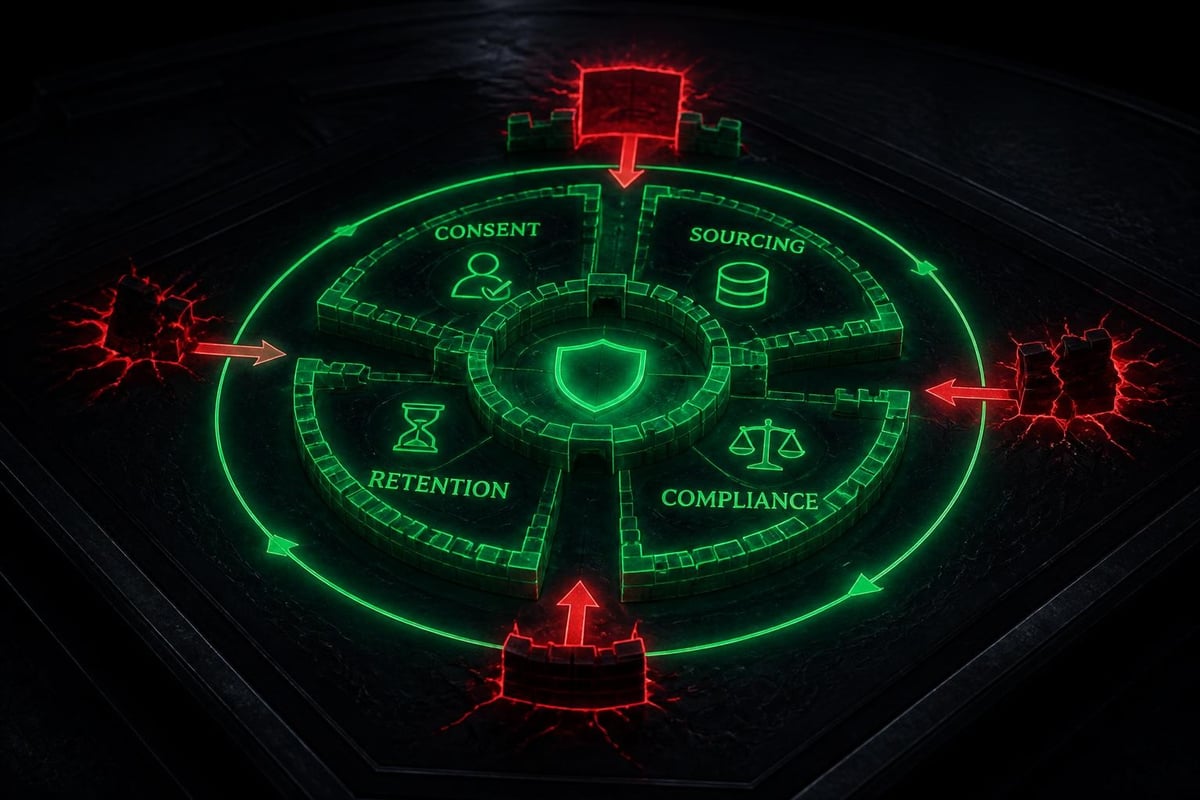
Consumer intelligence lives or dies on data quality and legal defensibility. In 2026, that means navigating a minefield of privacy regulations, platform restrictions, and enforcement actions that didn't exist five years ago. If your consumer intelligence company is still sourcing data the way it did in 2019, you're inheriting risk.
The landscape:
- GDPR, CCPA, and expanding state laws require explicit consent for most consumer data collection and give users rights to access, delete, and opt out.
- Platform policy changes (iOS ATT, Google's Privacy Sandbox, cookie deprecation) have cut off passive tracking methods that legacy providers relied on.
- Regulatory enforcement is real and escalating. The FTC’s recent actions against data brokers selling sensitive location data show that "everyone does it" is not a defense.
A responsible consumer intelligence company builds compliance into data acquisition from the start: explicit consent, transparent sourcing, documented retention and deletion procedures, regular audits. An irresponsible one treats compliance as a legal footnote and pushes the liability onto you when regulators come asking.
Questions to Ask Before You Sign
Before you commit to a consumer intelligence company, get answers in writing. Not marketing answers – contract-backed answers.
- Data sourcing: Where does the data come from? (Named partners, owned panels, scraped public sources, purchased feeds?) How was consent obtained? Can you audit the source agreements?
- Methodology transparency: What statistical methods are used for segmentation, weighting, trend detection? Can you access the raw data or are you locked into their dashboards?
- Refresh cadence: How often is the data updated? Is it continuous, monthly, quarterly? What's the lag between signal and delivery?
- Competitive overlap: Do they serve your direct competitors? If so, how is your proprietary usage data and strategic context protected?
- Exit terms: If you cancel, do you retain access to historical data? Can you export it in a usable format, or does it vanish?
If the provider won't answer these clearly, they're either hiding something or they haven't thought it through. Either way, you're the one holding the risk.
Integration: The Gap Between Insight and Action
A consumer intelligence company can hand you a perfect report that never changes a single decision. The gap between insight and action is integration: Can the intelligence flow into the tools, rhythms, and people who actually make calls?
Integration failures look like this:
- Research reports land in email, get skimmed in a meeting, then filed in a shared drive nobody searches
- Dashboards require separate logins, aren't mobile-responsive, and don't update fast enough to inform weekly planning
- Segmentation schemes don't match how your CRM or ad platform tags customers, so activation requires manual translation every time
- Analysts speak a different language than product, marketing, and sales – so insight stays theoretical
The best consumer intelligence systems are built backward from decisions. Start with the question: What decision changes if we know X? Then design data collection, analysis, and delivery to land the answer in the right person's workflow at the right time.
Building a Decision-Driven Intelligence System
Whether you build, buy, or blend, the system needs three things to matter:
- Tight feedback loops: Insight arrives fast enough to shape the decision it's meant to inform, not three weeks after you've already moved.
- Embedded delivery: Intelligence shows up inside the tools people already use (CRM, BI dashboards, planning docs, Slack) – not in a separate portal they have to remember to check.
- Shared language: Segmentation, metrics, and frameworks match how the organization already thinks and talks, so adoption is friction-free.
Think with Google’s research on consumer behavior and measurement offers practical case studies of how marketing teams connect insight to execution – not just collecting data, but using it to shift budget, creative, and targeting in real time.
The Build-Your-Own Path: Platforms and Aggregators
If you're not ready to hire a full-service consumer intelligence company but in-house build feels too slow, the middle ground is platform-enabled assembly. You use best-in-class tools for specific jobs – survey platforms, sentiment aggregators, analytics engines – and stitch them together with your own logic.
Common stack components:
- Survey and panel tools: Qualtrics, SurveyMonkey, Typeform for owned research; Cint, Lucid, Dynata for access to consumer panels
- Social and sentiment: Brandwatch, Sprout Social, Mention for tracking brand and category conversation across platforms
- Behavioral and transactional: Google Analytics, Segment, Mixpanel for digital behavior; second-party data partnerships for offline signals
- Analysis and BI: Tableau, Looker, Mode for dashboarding; Python/R environments for custom modeling
The advantage is control and cost. You pay for exactly what you use, you own the data and methodology, and you can swap components without losing the whole system. Research World’s summary of evolving market-research methods highlights this shift – fewer monolithic vendors, more modular stacks that teams assemble and manage themselves.
The disadvantage is overhead. You're now responsible for integration, uptime, training, and governance. If three tools break or update their APIs in the same quarter, you're the one fixing it. For lean teams, that tax can outweigh the cost savings.
Enterprise vs. Startup: Different Needs, Different Fits
The right consumer intelligence company for a Fortune 500 CPG brand is the wrong choice for a Series A SaaS startup. Needs, budgets, speed, and risk tolerance are different.
Enterprise Requirements
Large organizations need:
- Scale and coverage: Intelligence across dozens of categories, geographies, and customer segments
- Longitudinal consistency: The ability to compare trends year-over-year without methodology changes breaking continuity
- Compliance and audit trails: Documented data sourcing, consent management, and governance to satisfy legal and procurement
- Integration with legacy systems: Feeds into SAP, Salesforce, Adobe, and entrenched BI stacks
- Account management and training: Dedicated support to onboard teams, customize dashboards, and translate insight into internal language
Deloitte’s Digital Consumer Trends preview for 2025 shows how large enterprises are investing in AI-enabled consumer analytics and real-time behavioral signals to stay competitive – infrastructure-heavy approaches that require serious vendor partnerships.
| Enterprise Need |
Typical Solution |
Annual Cost Range |
| Multi-market consumer segmentation |
Full-service agency + syndicated panel access |
$500K–$2M+ |
| Always-on sentiment and brand tracking |
Managed platform (Brandwatch, Talkwalker) with analyst support |
$150K–$500K |
| Proprietary consumer panel |
Custom-recruited panel + quarterly wave studies |
$300K–$1M+ |
Startup and Scale-Up Requirements
Early-stage and growth companies need:
- Speed: Answers in days or weeks, not quarters
- Focus: Deep insight on a narrow segment or category, not broad coverage
- Affordability: Solutions in the $10K–$100K range, not half-a-million-dollar commitments
- Flexibility: The ability to pivot questions and methodology as the business model evolves
- Self-service: Minimal hand-holding, intuitive interfaces, fast onboarding
For startups, the best "consumer intelligence company" is often a platform that automates the grunt work and lets you run the strategy yourself. On the competitive side, that's where tools like BrandScout’s Competitive Analysis & Strategy fit: it runs proven frameworks (PESTEL, Five Forces, SWOT) automatically, generates strategic options, and delivers a 90-day plan grounded in your real data – without the six-month consultancy engagement.

When to Fire Your Consumer Intelligence Company
Relationships with consumer intelligence providers degrade slowly. Usage drops, reports go unread, renewal conversations feel like inertia rather than value. Here's when to cut it:
You should exit when:
- Insight no longer shapes decisions: If the last three strategy reviews didn't reference the research, you're paying for decoration.
- Methodology hasn't evolved: Markets and consumer behavior shift; if your provider is still running 2022 playbooks in 2026, they're behind.
- Cost per insight is climbing: Fewer people use it, but the contract auto-renews at higher rates – classic subscription trap.
- You've outgrown the fit: Early-stage tools don't scale to enterprise complexity; enterprise vendors don't bend to startup speed. Graduating is normal.
- Compliance risk is rising: If your provider can't document clean data sourcing and consent in 2026, the regulatory risk is yours.
Firing a vendor is cheaper than ignoring sunk cost. The question isn't "How much have we invested?" – it's "Does this make next quarter's decisions better?" If the answer is no, move.
The Hybrid Future: Platforms That Teach You to Think
The best consumer intelligence companies in 2026 aren't just data pipes – they're teaching systems. They automate the tedious work (data collection, cleaning, dashboarding) and use that efficiency to make the strategic work easier to learn and execute.
Instead of handing you a 50-slide deck, they show you how the segmentation was built, why certain signals matter, what trade-offs exist in the methodology. They make you better at asking the next question, not just answering the last one.
This is the shift from vendor to capability partner. You're not outsourcing intelligence – you're augmenting your team's ability to generate it. Over time, dependency drops, competence rises, and the platform becomes scaffolding for internal expertise rather than a crutch.
The same principle applies on the competitive-intelligence side. Platforms that map your competitive landscape, run proven strategic frameworks, and generate actionable battlecards aren't replacing your strategic thinking – they're making it faster, more rigorous, and grounded in real data instead of guesswork.
A consumer intelligence company is only as valuable as the decisions it changes. If you're paying for reports that gather dust, dashboards nobody checks, or insights that arrive too late to matter, you're renting a liability. The right move depends on fit: your speed, your budget, your competitive edge, and whether you need breadth or depth. Build when proprietary insight is your moat. Buy when speed and scale trump control. Use platforms when you want the infrastructure without the overhead. Brandscout takes the same approach on competitive intelligence – giving you the discovery, analysis, and strategy frameworks that make smart decisions faster, without locking you into someone else's doctrine.
AI in Content Marketing: Strategy Over Speed
Artificial intelligence in content marketing has moved from experimental to expected. Most companies now use AI to draft, optimize, or distribute content. The problem isn't adoption – it's direction. Tools that write faster or analyze engagement don't solve the strategic question: what should you say that competitors aren't already saying better? Without competitive intelligence feeding your AI systems, you're automating mediocrity at scale. The companies winning with AI in 2026 aren't just producing more content. They're producing different content because they know exactly where the market gaps are and how rivals are positioned.
The Real Question AI Can't Answer Alone
AI content tools solve execution problems. They generate outlines, write first drafts, optimize metadata, personalize email variants, and analyze performance metrics faster than any human team. Stanford’s 2025 AI Index shows generative AI adoption in marketing grew 340% year-over-year, with content creation leading every other category.
But speed without direction is just expensive noise.
What Gets Lost in Automation
When you ask an AI to "write a blog post about cloud security," it delivers grammatically correct, SEO-optimized prose. What it doesn't deliver:
- Strategic differentiation: Why your angle matters more than the dozen competitors who published similar posts last week
- Competitive gaps: What your rivals are saying (and not saying) that creates an opening for you
- Market positioning: How this content moves you toward or away from the perception you're fighting for
Artificial intelligence in content marketing excels at how to say something. It fails completely at what to say and why it matters strategically. That's not a technology problem. It's an intelligence problem.

Where Competitive Intelligence Transforms AI Output
The companies extracting real advantage from artificial intelligence in content marketing run competitive intelligence before they run content workflows. They map the landscape first, identify positioning gaps, then direct AI tools toward those openings.
The Discovery Problem
Most marketing teams can't answer basic questions about their competitive content landscape:
- Who are the top five voices in our category and what positioning do they own?
- What content gaps exist that our competitors aren't addressing?
- Which angles are oversaturated and which are open territory?
- How do competitor content strategies map to their broader market positioning?
You can't differentiate if you don't know what already exists. Manual competitive research – browsing competitor blogs, tracking social posts, reading whitepapers – takes weeks and goes stale immediately. By the time you've mapped the landscape, it's shifted.
BrandScout’s free competitor discovery database solves the first part of this: it surfaces every active competitor in your category, including rising ones you'd miss manually, and organizes them in a living view that updates as market signals arrive. You can't run competitive content strategy if you don't know who you're competing against.
Turning Signals Into Strategy
Once you have the competitive map, the next step is analysis. What positions do competitors own? Where are they vulnerable? What messages are they repeating (and therefore owning) versus what they're ignoring (and therefore leaving open)?
This is where proven strategic frameworks – SWOT, Porter's Five Forces, PESTEL – convert scattered observations into structured intelligence. You're not looking for what competitors publish. You're looking for why they publish it and what strategic territory that leaves exposed.
| Intelligence Layer |
What It Reveals |
How It Directs AI Content |
| Competitor messaging |
Positions they own, language they repeat |
Avoid their angles; target their blind spots |
| Content gaps |
Topics/formats they ignore or underinvest in |
Create content where competition is weakest |
| Audience signals |
Questions, complaints, unmet needs in community/review data |
Address what competitors aren't solving |
| Positioning shifts |
Changes in messaging, pricing, feature focus |
Anticipate moves; preempt or counter strategically |
Artificial intelligence in content marketing becomes strategic when you feed it competitive intelligence, not just keyword research. You're not asking "what keywords should I rank for?" You're asking "what position can I claim that competitors can't easily defend?"
How AI Content Fails Without Strategic Direction
The evidence is everywhere. Categories flooded with identical "ultimate guides." LinkedIn feeds full of indistinguishable thought leadership. Blog posts that rank but don't convert because they say nothing competitors haven't already said better.
The Commoditization Trap
Google’s March 2024 core update and spam policy explicitly targets low-value AI content created purely for ranking. The update doesn't penalize AI-generated content – it penalizes unhelpful content, regardless of how it's produced. The problem: most AI content workflows optimize for volume and SEO signals, not strategic value.
When everyone has access to the same AI tools and the same keyword data, differentiation collapses. You end up in a race to publish more variations of the same commoditized content. Even if you rank, you've built no durable advantage.
The Disclosure and Trust Problem
IEEE’s author guidelines for AI-generated text and the World Federation of Advertisers’ research on AI labeling point to an emerging transparency standard. Audiences and platforms increasingly expect disclosure when AI materially contributes to content.
The risk isn't legal. It's strategic. If your content feels generic, audiences assume it's AI-generated (whether it is or not) and discount it. Differentiation isn't just a ranking problem. It's a trust problem.

Building a Competitive-Intelligence-Driven Content System
The operating model that works in 2026 inverts the typical workflow. Instead of "brainstorm topics, write content, analyze performance," you run "map competitors, identify gaps, direct AI to fill them, measure strategic impact."
Step 1: Map the Competitive Content Landscape
You need a living view of who's publishing what, which positions they're reinforcing, and where they're going silent. This isn't a one-time audit. Competitive landscapes shift weekly as new players enter, incumbents pivot, and market narratives evolve.
What to track:
- Competitor blog topics, formats, and publishing frequency
- Messaging themes (what language they repeat across channels)
- Content investments (long-form guides, video, podcasts, tools)
- Audience engagement signals (what resonates, what's ignored)
Tools and methods:
Manual tracking doesn't scale. You need automation that surfaces competitors (including rising ones), organizes their signals, and flags meaningful shifts. Market intelligence platforms built for competitive analysis keep this layer current without consuming your team's time.
Step 2: Analyze for Strategic Openings
Once you have the map, you need to interpret it. Where are competitors clustered (oversaturated positions)? Where are they absent (open territory)? What strategic moves are they signaling through content shifts?
This is where frameworks matter. A SWOT analysis reveals competitor content strengths you should avoid and weaknesses you should exploit. PESTEL analysis surfaces macro trends competitors are ignoring that you can own early.
| Framework |
What It Reveals |
Content Application |
| SWOT |
Competitor content strengths/weaknesses |
Target their weak topics; avoid their strong ones |
| Porter's Five Forces |
Competitive intensity, substitutes, barriers |
Identify defensible content niches |
| PESTEL |
External trends competitors miss |
Own emerging narrative territory early |
Step 3: Direct AI Toward Differentiated Positions
Now you're ready to deploy AI – but with strategic direction. You're not asking it to "write about X." You're asking it to "address X from angle Y, targeting audience segment Z, countering competitor position A."
Example prompt structure:
"Write a 1,200-word guide on multi-cloud security for mid-market CTOs. Competitors focus on enterprise compliance; we're targeting cost control and vendor lock-in concerns. Emphasize practical implementation over theory. Avoid jargon competitors overuse (zero-trust, defense-in-depth). Lead with budget risk, not technical architecture."
The AI still does the writing. But you've constrained it strategically. You've told it where to attack and what to avoid. That's the difference between generic content and positioned content.
Step 4: Measure Strategic Impact, Not Just Traffic
Typical content analytics track pageviews, time-on-page, keyword rankings. Those metrics tell you if people found your content. They don't tell you if it moved your strategic position.
Better metrics:
- Share of voice in target positioning: Are you becoming known for the angle you're claiming?
- Competitive displacement: Are prospects mentioning you instead of rivals in consideration sets?
- Content-attributed pipeline: Which content moves deals forward versus just attracting traffic?
- Message penetration: Is your differentiated language showing up in customer/prospect conversations?
HubSpot’s AI in content marketing guide and Content Marketing Institute’s research both highlight that leading teams shifted from volume-based metrics to strategic-impact metrics in 2025. Traffic is a lagging indicator. Position is a leading one.
Common Mistakes That Waste AI's Potential
Even teams that understand the strategic imperative make predictable errors when deploying artificial intelligence in content marketing.
Mistake 1: Letting AI Choose the Topics
AI can analyze search volume and suggest high-traffic keywords. It can't assess strategic fit or competitive risk. If you let tools pick your topics based purely on opportunity scores, you'll chase rankings in categories where competitors already own the position.
Fix it: Use competitive intelligence to identify topics where you can claim a differentiated angle, then use AI to optimize execution within those constraints.
Mistake 2: Assuming AI Output Is Ready to Publish
Even well-prompted AI produces generic drafts. It lacks your company's voice, your market-specific context, and the strategic nuance that separates positioned content from commodity content.
Fix it: Treat AI as a first-draft engine. Human editors add strategic polish, inject proprietary insights, and ensure the content reinforces your positioning. According to the IAB’s June 2024 generative AI whitepaper, brands achieving measurable ROI from AI content invest 30-40% of saved time back into strategic editing and differentiation.
Mistake 3: Running Content in Isolation from Competitive Moves
Your competitors aren't static. They're launching campaigns, shifting messaging, entering new segments. If your content strategy doesn't adapt in real time to competitive moves, you're fighting yesterday's battle.
Fix it: Integrate competitive intelligence monitoring into your content operations. When a competitor launches a major campaign or shifts positioning, your content should respond – either to counter their move or exploit the opening they created.

What This Looks Like in Practice
A B2B SaaS company selling project management software faces a crowded market. Competitors include Asana, Monday, ClickUp, and dozens of smaller players. Everyone's blog covers the same topics: productivity tips, remote work guides, project management best practices.
The Old Approach
The marketing team uses AI to produce two blog posts per week. Topics come from keyword research. AI writes first drafts. Editors polish and publish. Traffic grows modestly. Conversions stay flat. The content ranks, but it doesn't differentiate. Prospects read it and still choose Asana.
The Intelligence-Driven Approach
The team maps the competitive content landscape. They discover:
- Asana owns "team productivity" messaging (high volume, consistent reinforcement)
- Monday owns "visual project management" (strong brand association)
- ClickUp owns "all-in-one" positioning (but skews toward power users)
- Gap: mid-market teams struggling with tool sprawl (underserved segment, light competitive coverage)
They pivot content strategy:
- Target the tool-sprawl pain point competitors ignore
- Create content addressing consolidation (vs. trying to out-produce Asana on productivity)
- Use AI to scale execution within this focused strategic angle
- Measure share of voice around "tool consolidation" and pipeline from that segment
Six months later, they own "consolidation" mindshare in mid-market conversations. Prospects mention them alongside the big players – not because they out-published competitors, but because they claimed differentiated territory competitors weren't defending.
The Governance Layer You Can't Skip
Artificial intelligence in content marketing introduces risk if you don't govern it. Bad AI content damages brand credibility faster than good AI content builds it.
Quality Controls
- Human review gates: No AI output publishes without strategic editing
- Brand voice enforcement: Templates and guidelines that constrain AI toward your voice
- Fact-checking protocols: AI hallucinates sources and statistics; verify everything
- Disclosure policies: When and how you label AI contributions (follow IEEE guidelines)
Strategic Alignment
Every piece of content should answer:
- What strategic position does this reinforce?
- What competitive gap does this exploit?
- How does this move us toward our target market perception?
If you can't answer those questions, the content is noise – no matter how well-written or optimized.
The Competitive Advantage Window Is Closing
In 2024, using artificial intelligence in content marketing gave you a speed advantage. In 2026, everyone has the same tools. Speed is table stakes. The new advantage is strategic direction – knowing where to apply that speed.
The companies pulling ahead are the ones integrating competitive intelligence into content workflows before they hit the AI execute button. They're mapping competitors, analyzing gaps, claiming open territory, and using AI to scale execution within those strategic constraints.
The ones falling behind are still chasing keyword volumes and traffic metrics, wondering why more content isn't producing more pipeline. They're optimizing the wrong variable.
If you're deploying AI content tools without competitive intelligence guiding them, you're in an arms race you can't win. Someone with a bigger budget will always out-publish you. But if you're using intelligence to identify positions competitors can't easily defend, you're in a different game – one where insight beats volume.
Artificial intelligence in content marketing delivers scale, but competitive intelligence delivers direction. Without both, you're either too slow or too scattered to matter. Brandscout helps you map your competitive landscape, identify strategic gaps, and turn market signals into actionable content strategies – so your AI tools build differentiation, not just volume. Stop producing faster noise. Start claiming territory competitors aren't defending.
AI and Marketing: From Hype to Hard Intelligence
AI and marketing have become inseparable in business conversations, yet most companies still treat AI as a feature rather than a structural advantage. The gap between promise and execution has never been wider. Vendors pitch automation, personalization, and prediction, while marketers struggle with fragmented tools, unreliable outputs, and strategies that collapse under competitive pressure. The real question isn't whether to use AI, it's whether your AI use creates a position competitors can't easily copy.
The Current State: Adoption Without Strategy
Marketing teams adopted AI faster than almost any other business function. Stanford’s AI Index shows marketing and sales lead cross-industry AI implementation, yet competitive advantage remains elusive for most. The explanation is simple: everyone adopted the same tools at roughly the same time.
What most companies deployed:
- Email personalization engines
- Chatbot customer service layers
- Programmatic ad buying platforms
- Content generation assistants
- Predictive lead scoring models
These tools create efficiency, not differentiation. Your competitor bought the same SaaS subscription. They're personalizing emails to the same segment definitions. They're bidding in the same ad auctions with similar algorithms. Efficiency gains compress quickly into table stakes.
The gap emerges in what you feed the AI and how you structure the decision. A content generator is worthless if you don't know which message angles exploit competitor weaknesses. Personalization fails if you're personalizing the wrong value proposition. Predictive models optimize toward the wrong goals if your strategic premise is flawed.
Intelligence Before Automation
AI and marketing succeed when intelligence precedes automation. Most teams reverse the order. They automate existing processes, then wonder why results plateau. The pattern repeats: implement tool, see short-term lift, watch competitors catch up, return to parity.

Strategic intelligence answers questions automation can't:
- Which competitors are gaining share and why?
- What messaging gaps exist in the category?
- Which customer segments face underserved needs?
- Where are competitive defenses weakest?
- What market shifts will invalidate current plays?
Answer these first. Then automate execution against that clarity. The sequence creates advantage because collecting and structuring competitive intelligence doesn't scale the way automation does. Your competitor can buy the same marketing automation platform tomorrow. They can't reconstruct six months of structured competitive analysis overnight.
Where AI Actually Delivers in Marketing
Three areas show durable returns: competitive intelligence, creative testing, and channel optimization. Not coincidentally, these are areas where data volume exceeds human processing capacity and where speed of iteration matters.
Competitive Intelligence at Scale
Manual competitive research dies under its own weight. Track five competitors across ten channels with weekly updates and you've created a full-time job that still misses signals. AI changes the math. BrandScout’s Competitor Discovery & Tracking surfaces competitors automatically, including emerging players you'd miss in manual research, then maintains current intelligence as new signals arrive.
The leverage comes from structured, queryable competitive data rather than scattered notes and bookmarked tabs. When a competitor launches a new feature, changes pricing, or shifts messaging, that data point connects to your existing competitive map. You can ask: "Which competitors emphasize speed over cost?" or "Who's moved upmarket in the last quarter?" The system answers immediately because the intelligence is structured, not buried in documents.
| Traditional Competitive Research |
AI-Powered Intelligence |
| Manual competitor identification |
Automated discovery including hidden players |
| Quarterly snapshot updates |
Continuous signal monitoring |
| Spreadsheets and scattered notes |
Structured, queryable database |
| Analysis bottlenecked by analyst time |
Analysis scales with data volume |
| Insights trapped in reports |
Intelligence feeds directly into strategy and execution |
This capability matters more as markets fragment. You're not competing against three obvious rivals anymore. You're competing against twenty companies, half of whom entered the category in the last eighteen months. AI doesn't get tired tracking them.
Creative Testing and Brand Management
Creative production and testing used to require weeks and significant budget. AI and marketing converge powerfully here: generate variations rapidly, test exhaustively, identify winning patterns, scale what works. The cycle compresses from months to days.
The risk is brand dilution. When AI generates hundreds of ad variations, maintaining consistent brand identity requires explicit guardrails. Harvard Business Review examined how AI can power brand management while preserving creative coherence through structured brand guidelines that AI systems enforce during generation.
Effective creative AI workflows:
- Define brand parameters (voice, visual style, value propositions)
- Generate variations within those constraints
- Test variations against segment hypotheses
- Identify performance patterns
- Feed winning patterns back into generation
- Maintain human review for brand-critical assets
The advantage compounds. Competitors testing three ad variations learn slower than your system testing thirty. You identify winning angles faster, scale them sooner, and move to the next test while they're still analyzing the first.
Channel Optimization and Personalization
Programmatic advertising, email sequencing, and website personalization benefit from AI's ability to process signals humans can't track. Which creative performs best for mobile users in Chicago who arrived via organic search on weekday mornings? AI answers that. Humans can't hold enough variables simultaneously.
The trap is optimizing tactics without strategic context. Personalization done right requires understanding not just who someone is, but what competitive alternatives they're considering. Personalizing your message to a prospect who's also evaluating two competitors requires knowing what those competitors emphasize. Otherwise you're personalizing into a vacuum.

Channel optimization AI works best when connected to competitive intelligence. If you know Competitor A emphasizes price and Competitor B emphasizes features, your personalization engine can emphasize the third dimension: service, speed, integration, simplicity. The AI executes the personalization, but strategy defines what to personalize toward.
The Execution Gap: Strategy, Then Tools
Most AI and marketing failures trace to implementation without strategy. Teams buy tools before answering strategic questions. The tools work as designed but optimize toward unclear goals.
Consider content generation. AI writes faster than humans, but what should it write about? If your content strategy is "create blog posts about our industry," AI will dutifully generate generic content that ranks nowhere and persuades no one. If your strategy is "create content that addresses the specific objections prospects raise when comparing us to Competitor X," AI becomes a force multiplier for a sound strategy.
The pattern holds across marketing functions:
- Email automation: Effective when you know which segments need which messages at which journey stages. Noise when you're just automating email for automation's sake.
- Ad optimization: Powerful when you've identified which value propositions resonate with which audiences. Wasteful when optimizing ads that communicate undifferentiated claims.
- Lead scoring: Accurate when built on clean data about what actually predicts conversion in your specific category. Misleading when trained on generic B2B patterns.
Strategy first means:
- Map the competitive landscape – who are you actually competing against for each customer segment?
- Identify positioning gaps – what valuable claims are competitors not making?
- Define win conditions – what does success look like for each strategic initiative?
- Structure data to answer strategic questions – not just to feed dashboards
- Implement AI to scale execution of the strategy, not to replace strategy
Competitive intelligence provides the foundation. Without clear understanding of competitive dynamics, AI optimizes in random directions.
Building Durable Advantage
AI and marketing create lasting advantage only when your AI inputs or processes are hard to replicate. Buying the same tools as everyone else creates parity. Three approaches create separation:
Proprietary Data Sets
If your AI learns from data competitors can't access, it produces insights they can't match. This means:
- Customer interaction data from your specific installed base
- Competitive intelligence gathered systematically over time
- Category-specific signal monitoring (regulatory filings, job postings, technology partnerships)
- Behavioral patterns from your unique customer journey
The accumulation effect matters. Six months of structured competitive intelligence creates a dataset competitors can't assemble overnight, even if they adopt identical tools tomorrow.
Strategic Frameworks That Structure AI Output
Generic AI output is generic. AI structured by proven strategic frameworks produces differentiated analysis. This separates business strategy tools from simple data aggregation.
Running Porter's Five Forces analysis, SWOT, or PESTEL through AI doesn't just speed up the process. It ensures every data point gets categorized within a strategic context. When a competitor raises prices, that's not just a fact to note, it's a signal about competitive intensity, supplier power, or positioning shift. The framework structures how AI interprets the signal.
Strategic frameworks AI should operationalize:
| Framework |
What It Reveals |
How AI Accelerates It |
| Porter's Five Forces |
Competitive intensity and market structure |
Continuous monitoring of all five forces across your category |
| SWOT |
Internal capabilities vs. external opportunities/threats |
Real-time competitive strength/weakness tracking |
| PESTEL |
Macro forces shaping your market |
Signal monitoring across political, economic, social, technological, environmental, legal domains |
| Ansoff Matrix |
Growth opportunity assessment |
Data-driven evaluation of market penetration, development, product development, diversification options |
These frameworks have endured because they force consideration of factors teams naturally overlook. AI makes them practical to run continuously rather than quarterly in a conference room.
Integration Across Marketing Functions
Most companies deploy AI in silos. Chatbot team uses one AI. Content team uses another. Ad team uses a third. None share data. The opportunity is integration: AI that connects competitive intelligence to content strategy to campaign execution to performance analysis.

When competitive intelligence feeds directly into campaign planning, and campaign performance feeds back into competitive analysis, you've built a system that learns. Competitors analyzing campaigns in isolation or gathering intelligence in isolation learn slower.
Risks and Governance
AI and marketing introduce specific risks that strategic leaders must govern. Ignoring them doesn't make them disappear, it makes them landmines.
Content Quality and SEO Risk
AI content generation at scale creates a new problem: masses of published content that damages rather than builds authority. Google’s guidance on AI-generated content is clear: quality matters more than volume, and AI content that exists only to manipulate rankings faces penalties.
The implication: AI should accelerate creation of genuinely useful content, not replace the strategic decision about what's worth creating. Generate outlines faster. Draft initial versions quicker. But maintain human judgment about value.
Privacy and Trust
Personalization requires data. Excessive personalization creeps customers out. The boundary between helpful and invasive is context-dependent and culturally variable. What feels personalized in one market feels surveillant in another.
Research on AI in marketing consistently identifies privacy, bias, and transparency as critical governance challenges. Competitive advantage built on practices customers find invasive proves fragile. Trust lost compounds.
Practical governance rules:
- Collect only data you'll actually use strategically
- Explain personalization in ways customers understand
- Allow opt-out without penalty
- Test AI outputs for bias before deployment at scale
- Maintain human review for customer-facing content
Governance isn't overhead, it's risk management. A privacy scandal or bias incident can erase years of brand building overnight.
Dependency and Capability Atrophy
Teams that outsource judgment to AI stop developing judgment themselves. If your marketing team can't evaluate competitive positioning without AI prompting them, you've created a capability deficit. AI should augment expertise, not replace learning.
Maintain human skill development in:
- Strategic analysis and critical thinking
- Competitive positioning and messaging strategy
- Customer psychology and persuasion fundamentals
- Market dynamics and business model evolution
AI executes faster, but humans must remain competent at the underlying disciplines. Otherwise you're vulnerable to AI failures, vendor lock-in, or competitors who understand principles you've forgotten.
Making It Operational
Abstract understanding doesn't move business. Operational implementation does. Here's what works:
Start with competitive intelligence infrastructure:
- Choose a system that structures competitive data, not just stores it
- Define which competitors and signals to monitor
- Establish regular intelligence review cadence
- Connect intelligence directly to strategy and campaign planning
- Measure whether intelligence actually informed decisions or just sat in dashboards
Layer AI on execution:
- Identify highest-volume, most repetitive marketing tasks
- Evaluate whether AI can execute them within quality standards
- Build feedback loops so humans review AI output and refine prompts
- Scale gradually, learning what works in your specific context
- Maintain human expertise in strategic decisions
Measure what matters strategically:
- Are we identifying competitive moves faster than before?
- Do campaigns reflect current competitive intelligence?
- Are we testing more variations and learning faster?
- Has AI freed strategic time or just created more outputs?
- Are competitive advantages compounding or eroding?
Don't measure "AI adoption." Measure whether AI improved strategic outcomes. Adoption without outcome is waste.
AI and marketing work when AI amplifies strategy, not replaces it. The technology excels at scale, speed, and pattern recognition, but strategy still requires human judgment about where to compete and how to win. If you're gathering competitive intelligence manually, analyzing competitors in isolation, or planning campaigns without current competitive context, you're conceding speed and insight to competitors who've connected those functions. Brandscout structures competitive intelligence, runs strategic analysis through proven frameworks, and generates actionable campaign plans grounded in your real competitive landscape, turning scattered market signals into the clarity and confidence strategic execution requires.
Market Plans: Build Strategy That Survives Contact
Most market plans die in the first thirty days. Not because the goals were wrong or the team was lazy, but because the plan was built on guesswork instead of intelligence. A market plan is not a wish list. It's not a slide deck you present once and forget. It's a decision framework that tells you where to fight, how to win, and what to ignore. If your plan doesn't account for what competitors are doing right now, it's already obsolete.
The difference between a plan that executes and one that collects dust is simple: does it reflect the actual battlefield or an imagined one? Market plans that work are grounded in real competitive intelligence, structured around clear strategic choices, and flexible enough to adapt when conditions change. Everything else is theater.
What Market Plans Actually Do
A market plan is a resource allocation decision wrapped in a timeline. It answers four questions: where are we competing, against whom, with what advantage, and over what period? Everything else in the document supports those answers.
The American Marketing Association defines a marketing plan as a roadmap for introducing and delivering your product or service to potential customers. That's accurate but incomplete. Market plans don't just introduce. They position, defend, and advance. They're built to handle interference, not operate in a vacuum.
The Core Components
Every functional market plan contains:
- Situational analysis: What's happening in your market right now – trends, competitive movements, customer behavior shifts
- Strategic framework: The logic that connects your position to your chosen moves (defensive fortification, offensive expansion, guerrilla disruption)
- Tactical choices: Channel priorities, messaging angles, partnership decisions, feature launches
- Resource map: Budget, team allocation, timeline dependencies
- Success metrics: Leading indicators that tell you if the plan is working before revenue proves it
The situational analysis is where most plans fail. If you don't know who's entering your space, what they're funding, or how customers are reacting to their moves, your strategy is just a bet.

Why Intelligence Comes Before Planning
You can't plan around threats you haven't identified. Market plans built on last quarter's assumptions are dead weight. Competitive landscapes shift: new entrants raise capital, incumbents pivot pricing, distribution partners choose sides. If your plan doesn't reflect current conditions, you're executing blind.
Forrester’s research on people-led planning emphasizes iterative, outcome-focused planning. That iteration requires input. Fresh intelligence. Real signals about what competitors are launching, where they're expanding, and how they're positioning against you.
BrandScout was built to solve this gap. Most teams collect competitive data in scattered tabs, Slack threads, and half-remembered conversations. Competitive intelligence needs structure. When you can map your competitive landscape, track movements in real time, and run proven strategic frameworks against actual competitor data, your market plans shift from guesswork to decision-making.
The Intelligence-to-Strategy Workflow
- Discovery: Identify every player in your space, including rising threats you'd miss manually
- Analysis: Run structured frameworks (SWOT, Porter's Five Forces, PESTEL) on real competitive data
- Strategy selection: Choose offense or defense doctrines based on position and capability
- Tactical translation: Convert strategic choices into channel priorities, messaging, and launch sequences
- Execution planning: Build the 90-day plan with milestones, owners, and leading metrics
This isn't linear. Intelligence updates continuously. New competitors appear. Customer preferences shift. Your plan should absorb those signals and adjust tactics without abandoning the core strategy.
Strategy Selection: Offense vs. Defense
Market plans require a posture. Are you defending market share or taking it? The answer determines everything: budget allocation, messaging tone, partnership strategy, product priorities.
Defensive strategies make sense when you hold position and face pressure. You're fortifying, not because you're weak, but because the cost of losing ground is higher than the reward of new territory. Offensive strategies suit challengers and leaders expanding into adjacent markets.
Jorge A. Vasconcellos e Sá identified fourteen competitive strategies: eight defensive, six offensive. These aren't abstract models. They're decision frameworks tested across industries and validated by outcomes.
Defensive Strategies in Market Plans
| Strategy |
When to Use |
Tactical Expression |
| Position Defense |
Leader under attack from multiple angles |
Double down on brand, increase share of voice, lock in long-term contracts |
| Flank Defense |
Vulnerable segment or geography threatened |
Launch targeted sub-brand, regional partnerships, localized campaigns |
| Preemptive Defense |
Competitor preparing major move |
Announce product roadmap early, lock key distribution, flood category with content |
| Counteroffensive Defense |
Direct attack on your core |
Strike competitor's weak flank, poach key accounts, aggressive win-back offers |
| Mobile Defense |
Market shifting, position eroding |
Diversify revenue streams, enter adjacent categories, redefine value proposition |
| Contraction Defense |
Overextended resources, multiple fronts |
Exit low-margin segments, consolidate to defensible core, rebuild profitability |
| Strategic Withdrawal |
Unwinnable position, better battles exist |
Shut down losing product lines, reallocate to growth areas, pivot messaging |
| Guerrilla Defense |
Smaller player vs. dominant incumbent |
Niche focus, community-driven growth, agility over budget |
Your business strategy guide should map these doctrines to specific competitive scenarios you face. The choice depends on your market position, resource base, and competitor capabilities.
Offensive Strategies in Market Plans
Offensive strategies assume you can take ground and hold it. They require confidence in your differentiation and the resources to sustain pressure.
- Frontal Attack: Direct assault on competitor's core strength (requires clear superiority in product, pricing, or distribution)
- Flanking Attack: Target underserved segment or geography competitor ignores
- Encirclement: Surround competitor with superior offerings across multiple dimensions (features, price tiers, integrations)
- Bypass Attack: Redefine the category, making competitor's position irrelevant (technology shift, business model innovation)
- Guerrilla Attack: Unpredictable, localized strikes that force competitor to overspend on defense (content blitzes, partnership surprises, viral stunts)
- Differentiated Circle Attack: Win by being fundamentally different in a way that matters to a specific segment
The doctrine you choose shapes your entire market plan. A flanking strategy dictates different channel priorities than a frontal attack. Understanding how differentiated attacks work helps you recognize when uniqueness beats scale.

Building the Tactical Layer
Strategy without tactics is philosophy. Market plans must translate doctrine into executable work. That means assigning channels, setting budgets, defining messages, and scheduling launches.
Channel Prioritization
Not every channel deserves equal investment. Your strategic posture determines where to concentrate resources.
Defensive postures favor:
- Owned channels (email, community, product-led content) where you control the conversation
- Long-form thought leadership that reinforces category authority
- Customer retention and expansion programs
- Strategic partnerships that lock in distribution or integrations
Offensive postures favor:
- Paid acquisition in competitor keywords and audiences
- High-frequency launches that dominate news cycles
- Aggressive content production targeting competitor weaknesses
- Outbound sales targeting competitor customer bases
Deloitte’s 2025 marketing investment trends show marketers shifting budget toward first-party data activation and AI-powered personalization. Your market plan should account for these industry-wide shifts while staying true to your strategic choice.
Messaging Architecture
Your messaging must reflect your strategy. A flanking attack requires different language than a position defense.
Flanking messages emphasize what incumbents ignore: "We serve [overlooked segment] because [major players] don't care about [specific need]." Position defense messages reinforce leadership: "The proven choice for [category]" or "Trusted by [credible customer base]."
Avoid generic benefit claims. Your competitive intelligence should reveal specific weaknesses in competitor positioning. Exploit those gaps directly.
Resource Allocation and Timeline Structure
Market plans fail when budget and reality diverge. You cannot defend on all fronts with limited resources. You cannot execute six offensive campaigns simultaneously without diluting impact.
The 90-Day Planning Cycle
Annual plans are fiction. Quarterly plans are testable. Ninety days is enough time to execute, measure, and adjust without committing to obsolete assumptions.
Your 90-day market plan should include:
- Primary objective: One strategic goal (e.g., defend 15% market share in enterprise segment, capture 5% share in mid-market)
- Three tactical bets: Channel experiments, partnership launches, or product releases
- Two defensive moves: Countermeasures against known competitor actions
- Weekly checkpoints: Leading indicators reviewed every seven days
- Kill criteria: Conditions under which you abandon a tactic and reallocate
The U.S. Small Business Administration provides templates that help structure budget and resource decisions in practical terms. Use them, but don't treat them as gospel. Your competitive situation may require unconventional allocations.
Budget Distribution Models
| Strategic Posture |
Brand/Awareness |
Demand Gen |
Customer Retention |
Competitive Response |
| Position Defense |
20% |
30% |
40% |
10% |
| Flanking Attack |
15% |
50% |
25% |
10% |
| Guerrilla |
10% |
35% |
30% |
25% |
| Frontal Attack |
25% |
55% |
10% |
10% |
These are starting points, not rules. Your pricing strategy and unit economics determine how aggressively you can fund acquisition versus retention.

Adapting When Conditions Change
Market plans are not contracts. They're hypotheses. The moment a competitor raises funding, launches a category-redefining feature, or partners with your key distribution channel, your plan must adapt.
Triggering Events That Demand Reassessment
- Competitor funding announcements: New capital changes their risk tolerance and speed
- Product launches that shift customer expectations: You're now behind the new baseline
- Major customer churn or win: Signal that positioning or product-market fit has changed
- Regulatory or economic shifts: Macro forces that rewrite cost structures or access
When these events occur, don't panic. Don't abandon strategy. Reassess your intelligence, confirm whether your core doctrine still fits, and adjust tactics. Harvard Business Review’s piece on marketing’s future explores how modern marketers must balance long-term positioning with rapid tactical iteration.
The teams that win aren't the ones with perfect plans. They're the ones who update their intelligence weekly, test new moves quickly, and kill losing bets without ego.
Measuring What Matters
Market plans need metrics that predict outcomes, not just record them. Revenue is a lagging indicator. By the time it moves, the battle is already won or lost.
Leading Indicators by Strategic Posture
Defensive plans track:
- Customer retention rate (weekly cohorts)
- Net Revenue Retention (NRR)
- Share of voice in key channels
- Competitive win/loss rates in deals
- Feature parity gaps vs. top competitors
Offensive plans track:
- New logo acquisition rate
- Competitive displacement rate (customers switching from named competitors)
- Time to first value for new customers
- Virality coefficient or organic growth rate
- Market penetration in target segment
The MIT Sloan case on crafting a marketing plan demonstrates how product-market fit metrics inform go-to-market strategy in practice. Study it. The logic transfers across industries.
Common Failures and How to Avoid Them
Market plans fail predictably. Here's what kills them:
The Wish List Trap
Plans that list every possible tactic without prioritization. You can't do everything. Choose three bets per quarter and fund them properly. Kill the rest.
The Static Plan Problem
Plans written in January and never updated. Competitive intelligence should flow into your plan continuously. If you're not revising tactics monthly, you're flying blind.
The Metrics Vanity Show
Tracking impressions, clicks, and engagement without connecting them to strategic outcomes. Measure what predicts customer acquisition, retention, and competitive displacement. Ignore the rest.
The Ivory Tower Syndrome
Plans built by executives without input from sales, customer success, or product teams who see competitor moves daily. Your best intelligence comes from the front line. Use it.
The Framework Addiction
Over-reliance on analysis frameworks without tactical translation. SWOT analysis doesn't execute itself. Neither does Porter's Five Forces. Run the frameworks, then make decisions and assign work.
Building Plans That Execute
The best market plans are boring documents. They specify who does what, by when, with what resources, against which competitor moves. They don't inspire. They direct.
If your market plan doesn't answer these questions clearly, rewrite it:
- Which competitors are we prioritizing this quarter and why?
- What is our primary strategic posture (offensive or defensive) and which doctrine applies?
- What three tactical bets will we fund fully, and what are we explicitly not doing?
- What leading indicators will we review weekly to confirm the plan is working?
- Under what conditions do we pivot or abandon this approach?
Your plan should fit on two pages. Everything else is appendix. Situational analysis, framework outputs, detailed channel plans – those belong in supporting documents. The plan itself is pure decision and assignment.
The competitive intelligence database playbook walks through how high-growth companies structure ongoing intelligence collection so market plans stay current. Build the system once. Let it feed every planning cycle.
The Continuous Intelligence Loop
Market plans aren't annual projects. They're living documents fed by continuous competitive intelligence. When you map your competitive landscape properly, track competitor moves as they happen, and run strategic frameworks against real data, planning shifts from guesswork to pattern recognition.
You start seeing moves before competitors make them. You recognize when a competitor's hiring spree signals a product launch. You notice when their messaging shifts toward your core segment. You adapt your plan before they execute, not after.
This is the advantage intelligence-backed market plans deliver: you stop reacting and start dictating tempo. Your competitors respond to you, not the other way around.
Market plans only work when they're grounded in competitive reality and structured around clear strategic choices. If you're building plans on scattered intelligence and outdated assumptions, you're already behind. Brandscout gives you the competitive intelligence infrastructure and strategic frameworks to build market plans that survive contact with the market. Map your landscape, run the analysis, and execute with confidence.
Competitor Database: Build the System That Scales Intelligence
A competitor database sounds simple until you try to build one that actually works. Most teams start with good intentions-a spreadsheet, a Notion page, maybe a Slack channel where someone shares competitor sightings. Six months later, it's chaos: outdated entries, duplicate records, no one knows what's real anymore, and the executive asking "who are we up against?" gets three different answers depending on who's in the room. The gap between "tracking competitors" and "having usable intelligence" is where most organizations die quietly, outmaneuvered by rivals who solved the same problem better.
The hard truth: a competitor database is not a list. It's a decision-support system. If it doesn't help you decide faster and smarter than your competitors, it's decorative. This article shows you how to build a competitor database that scales with your business, stays current without heroic manual effort, and actually drives strategy instead of gathering dust.
What a Competitor Database Actually Does
A competitor database organizes every entity competing for your customer's attention, budget, or loyalty into a structured, queryable view. That includes direct competitors (same solution, same market), indirect competitors (different solution, same job-to-be-done), and emerging threats (adjacent categories moving into yours).
The system must answer three questions instantly:
- Who are we up against? Complete roster, segmented by threat level, category, and strategic posture.
- What are they doing? Product changes, pricing moves, messaging shifts, funding events, leadership changes.
- What does that mean for us? Implications, vulnerabilities to exploit, attacks to defend against.
If your database can't answer all three, it's incomplete.
The Architecture of Usable Intelligence
A working competitor database has four layers:
Discovery layer: How new competitors enter the system. Manual entry doesn't scale; you need automated signals (web scraping, news feeds, social listening, funding databases) plus human curation to filter noise. BrandScout’s free competitor discovery tool solves this by surfacing hidden and rising competitors automatically, then organizing them in a living view that updates as new intelligence arrives.
Entity resolution layer: Deduplicates records and links related entities. Company name variations, acquired brands, renamed products-without canonicalization, you get fragmented data and bad decisions. Research on scalable entity resolution architectures offers technical guidance for building reliable linkage at scale.
Enrichment layer: Appends structured metadata to each competitor (category, size, funding stage, tech stack, key personnel, strategic posture). This transforms a flat list into a multi-dimensional map you can slice by any attribute.
Analysis layer: Connects competitor data to frameworks (SWOT, Five Forces, Ansoff) and outputs actionable strategy. Most databases stop at enrichment and leave teams staring at dashboards, paralyzed. The analysis layer is where intelligence becomes a play.

Building the Schema That Scales
Your data model determines what questions you can answer later. Build it too narrow, and you'll outgrow it in six months. Build it too complex, and no one will maintain it.
Core Entities and Relationships
Start with three tables:
| Entity |
Key Fields |
Purpose |
| Competitors |
Name, category, founded date, HQ location, employee count, funding stage |
Canonical record for each competitor |
| Products |
Product name, launch date, pricing model, target segment, key features |
What they sell and to whom |
| Events |
Event type (funding, launch, hire, pivot), date, source, impact score |
Timeline of competitive moves |
Link them with foreign keys: each Product belongs to a Competitor; each Event references a Competitor or Product. This relational structure lets you query "show me all SaaS competitors who raised Series B in 2025 and launched a freemium tier" in seconds.
Add a Sources table to track where intelligence came from (URL, date scraped, reliability score). Data governance frameworks that map GDPR interplay become critical when you're collecting public-web signals across jurisdictions. Document provenance or risk compliance exposure.
Metadata Taxonomy
Enrich each competitor with categorical tags:
- Strategic posture: Leader, challenger, niche specialist, new entrant
- Business model: SaaS, marketplace, transaction, advertising
- Target segment: SMB, mid-market, enterprise, prosumer
- Threat level: Critical (direct overlap, strong), moderate, watching
Consistent taxonomy enables filtering and pattern recognition. "Show me all enterprise-focused challengers with recent funding" becomes a two-click query instead of a manual review.
Privacy and Legal Boundaries
Competitor databases often include data scraped from public sources, which triggers legal and ethical questions. The FTC’s annual reporting and strategic guidance provides context on how competition authorities view information-gathering practices. Stay inside fair use, respect robots.txt, and understand the legal basis for processing under GDPR if you're collecting behavioral or personal data.
Don't store more than you need. If you're tracking a competitor's pricing, you don't need the names of their sales reps unless there's a strategic reason.
Keeping the Database Current Without Heroic Effort
Static databases rot fast. A competitor who looked irrelevant in January can be your biggest threat by June. The question is how to stay current without hiring someone full-time to refresh spreadsheets.
Automated Signal Ingestion
Set up feeds that push updates into your database automatically:
- News APIs for mentions of competitor names
- Job board scrapers to detect hiring spikes (signal of expansion or new product development)
- Funding trackers (Crunchbase, PitchBook) for capital events
- Product Hunt, G2, Capterra for new launches and user sentiment
- GitHub activity if competitors are open-source or developer-focused
Practical data-modeling patterns like Microsoft’s Unified Data Model offer a scalable schema approach for integrating heterogeneous signals into one governed structure.
Run nightly jobs to deduplicate, score relevance, and surface high-priority changes. Low-impact signals (blog posts, minor UI tweaks) go into the log; high-impact signals (pricing changes, executive departures, new market entry) trigger alerts.
Human-in-the-Loop Curation
Automation finds signals; humans decide what they mean. Build a weekly triage workflow:
- Review flagged high-priority events
- Validate accuracy (is this real or a rumor?)
- Update threat scores and strategic posture
- Flag implications for your roadmap or positioning
This takes 60-90 minutes per week instead of 8 hours of manual research. The leverage is enormous.
Quality and Deduplication
AI-driven approaches to master data management improve data quality through automated deduplication and enrichment. When two scrapers pull the same competitor under slightly different names, entity resolution merges them without manual reconciliation.
Set quality thresholds: any competitor record missing >30% of core fields gets flagged for review. Incomplete data is worse than no data because it gives false confidence.

Turning Data Into Decisions
A database full of accurate competitor records is useless if no one knows what to do with it. The analysis layer connects intelligence to action.
Segmentation and Prioritization
Not all competitors deserve equal attention. Segment by:
- Direct revenue threat: Do they compete for the same deals?
- Strategic position: Are they moving into your stronghold or away from it?
- Momentum: Recent funding, product velocity, market share trends
Focus 80% of analytical effort on the top 20% of threats. The rest go into "watching" status with automated monitoring.
Framework Integration
Run your competitor data through proven strategic frameworks:
- Porter's Five Forces to map bargaining power, threat of substitutes, competitive rivalry
- SWOT to identify their vulnerabilities and your attack surface
- Ansoff Matrix to predict their next growth move (market penetration, product development, market expansion, diversification)
BrandScout's premium competitive analysis runs these frameworks automatically and outputs 90-day action plans grounded in real competitive data, solving the "I have a list but don't know what to do with it" problem.
Battlecard Generation
Sales teams need competitor intelligence compressed into decision aids: one-page battlecards that show positioning, strengths/weaknesses, objection handling, and win themes. Pull directly from your competitor database:
- Positioning: How they describe themselves vs. how you should describe them
- Weaknesses: Where they're vulnerable (pricing, support, feature gaps, churn)
- Proof points: Wins you've had against them, customer quotes, comparative data
Update battlecards quarterly or when a competitor makes a major move. Outdated battlecards lose deals.
Governance, Access, and Cross-Functional Use
A competitor database serves multiple teams. Product wants to know feature gaps. Marketing wants messaging angles. Sales wants objection handling. Strategy wants market maps. Each needs different views of the same underlying data.
Role-Based Access
Not everyone should see everything. Sensitive intelligence (pricing details, customer defection data, legal risks) gets restricted access. Public data (product features, press releases, team size) is open to all.
Define access tiers:
- Public tier: Basic competitor profiles, publicly stated positioning
- Internal tier: Enriched data, SWOT analysis, threat scores
- Leadership tier: Financial estimates, strategic vulnerabilities, attack plans
Cross-Functional Workflows
Integrate your competitor database into existing workflows:
- Product planning: Query competitors by feature set to find gaps
- Pricing reviews: Compare pricing models and positioning tiers
- Campaign planning: Identify competitors' weak messaging angles
- Sales enablement: Auto-generate battlecards from database fields
The database becomes infrastructure, not a side project.
Synthetic Data for Testing and Sharing
When sharing competitive intelligence externally (partners, investors, advisors), consider synthetic data approaches outlined by the World Economic Forum. Synthetic datasets preserve structure and patterns while removing real competitor identities, reducing legal and privacy risk.

Common Failures and How to Avoid Them
Most competitor databases fail predictably. Here's how to sidestep the traps.
Failure Mode 1: No Single Source of Truth
Three people maintain three different lists. When leadership asks "who are our top competitors?" the room argues. Fix: Designate one canonical system. Sunset all shadow databases. Enforce it.
Failure Mode 2: Too Much Manual Effort
Someone spends 10 hours a week updating records by hand. They leave, the database dies. Fix: Automate signal ingestion. Human effort should go into curation and analysis, not data entry.
Failure Mode 3: Data Without Analysis
You have 200 competitor profiles and no idea which five matter most. Fix: Add threat scoring, segmentation, and framework integration. Raw data is not intelligence.
Failure Mode 4: Ignoring Emerging Threats
You track the obvious incumbents and miss the startup that steals your market in 18 months. Fix: Automated discovery that surfaces rising competitors based on funding, hiring, and market signals-not just brand recognition.
Failure Mode 5: Privacy or Legal Exposure
You scrape competitor sites aggressively, ignore robots.txt, store personal data without legal basis, and get a cease-and-desist or GDPR complaint. Fix: Ethical web scraping frameworks and documented data governance. Consult legal before deploying any automated collection at scale.
Scaling Across Multiple Brands or Clients
Agencies, incubators, accelerators, and multi-brand companies face a compounding problem: running competitive intelligence for 10 brands means 10x the discovery, tracking, and analysis work. Most teams either do shallow research across all brands or deep research on one and neglect the rest.
The solution is multi-tenant architecture: one system, multiple isolated competitive landscapes. Each brand gets its own competitor roster, analysis, and strategy, but you manage them all from a single interface. This eliminates repeated work and keeps every brand's intelligence current without multiplying headcount.
BrandScout's multi-brand offering runs the full discovery-to-strategy workflow across separate competitive landscapes from one account, solving the scale-and-repetition problem of redoing CI for each brand or client.
The ROI of a Well-Built Competitor Database
Quantify the value:
- Faster decisions: Executives get answers in minutes instead of waiting days for someone to research and compile a memo.
- Better positioning: Marketing and sales know exactly where you win and lose, so messaging hits harder.
- Reduced risk: Early warning on competitive moves (pricing cuts, new entrants, feature launches) gives you time to respond instead of scrambling.
- Higher win rates: Sales armed with current battlecards and competitive intelligence close more deals against named competitors.
One enterprise SaaS company tracked a 12% increase in win rate after rolling out structured competitor battlecards pulled from their database. Another reduced time-to-insight on new competitors from two weeks to two hours. The ROI isn't speculative-it's measurable.
A competitor database is the difference between reacting to threats after they've already hurt you and seeing them in time to counter or exploit them. Build it as a system-discovery, resolution, enrichment, analysis-or accept that your rivals are operating with better intelligence. BrandScout turns scattered market signals into structured intelligence, so you can map your competitive landscape, run strategic analysis, and act with confidence instead of guesswork.
Data Signals: Building Intelligence from Market Noise
Every market generates more data than any team can process. Competitor launches. Customer complaints. Pricing changes. Feature releases. Social mentions. Traffic patterns. The question isn't whether signals exist. The question is whether you're capturing the ones that matter and filtering out the noise that doesn't. Most intelligence operations fail not from lack of data but from drowning in undifferentiated information. Data signals are the specific, measurable indicators that reveal competitive movement, market shifts, and strategic opportunity. The difference between signal and noise determines whether you respond to genuine threats or chase phantoms.
What Makes a Data Signal Worth Tracking
Not all information qualifies as a usable signal. A signal carries three properties: it's measurable, it changes over time, and that change means something. A competitor's homepage exists but doesn't signal anything until it changes. The change itself becomes the signal. When that competitor rewrites their value proposition, launches a new tier, or promotes a different use case, you've received intelligence about strategic direction.
Signals fall into categories based on source and reliability:
- Behavioral signals – what customers, prospects, and competitors actually do (product usage, feature adoption, buying patterns)
- Declarative signals – what entities say publicly (press releases, blog posts, job listings, earnings calls)
- Technical signals – system-level indicators (site performance, API changes, infrastructure shifts, integration patterns)
- Economic signals – financial movements that suggest strategy (pricing changes, funding rounds, headcount growth)
The OpenTelemetry project distinguishes signal types – metrics, logs, traces – to build observability systems. The same discipline applies to market intelligence. Each signal type answers different questions and requires different collection methods.
Volume vs. Value in Signal Collection
You could track everything. Job postings. Patent filings. GitHub commits. Social engagement. Ad spend. Traffic rank. The cost isn't storage anymore; it's attention. Every signal you track competes for the same analytical bandwidth. High-volume, low-value signals create the illusion of coverage while obscuring the patterns that matter.
The filtering question: does this signal predict or explain a competitive move that changes our position?
If a competitor hires a VP of Sales in a region you don't serve, that's noise. If they hire one in your core market after six months of account-level losses, that's signal. Context transforms data into intelligence. The challenge is encoding that context so your systems can separate the two at scale.

Capturing Signals Across Fragmented Sources
Markets don't emit signals through a single channel. Your competitor's strategy reveals itself in pieces: a pricing table on their site, a case study highlighting a new vertical, a support article for a feature you didn't know existed, a LinkedIn post celebrating a partnership. No single source tells the story. Pattern recognition requires assembling signals from across the landscape.
| Signal Source |
Signal Type |
Refresh Frequency |
Intelligence Value |
| Product pages |
Feature releases, positioning changes |
Weekly |
High |
| Pricing pages |
Tier structure, packaging, discounts |
Daily |
Critical |
| Job listings |
Hiring priorities, expansion plans |
Daily |
Medium |
| Support docs |
Feature depth, integration coverage |
Weekly |
High |
| Customer reviews |
Satisfaction trends, feature gaps |
Weekly |
Medium |
| Traffic patterns |
Demand shifts, market traction |
Monthly |
Medium |
Apache Kafka and similar event-streaming platforms handle high-volume signals in real-time systems. The same principles apply to market intelligence: ingest from multiple sources, maintain temporal ordering, enable replay for pattern analysis. The difference is your "events" are competitor actions, not user clicks.
The Identity Problem in Market Signals
When a competitor announces a feature, posts a case study, and updates their product page, are those three signals or one? Identity resolution, the problem plaguing advertising measurement as third-party cookies disappear, affects competitive intelligence too. Without a unifying view, you count moves multiple times or miss the connection between related changes.
Solve it with entity resolution: every signal tags back to a competitive entity (company, product, feature set) and a signal type. When three sources report the same product launch, your system recognizes them as correlated signals confirming a single event, not three independent moves.
Turning Signals Into Patterns That Inform Strategy
Individual signals inform you. Patterns inform strategy. When a competitor raises prices, that's a data point. When they raise prices, cut low-tier features, and launch enterprise positioning over eight weeks, that's a pattern. It signals a strategic shift upmarket. Your response changes accordingly.
Pattern types to track:
- Positioning drift – gradual changes in messaging, audience, or use-case emphasis
- Feature velocity – rate of capability addition in specific areas (integrations, analytics, automation)
- Market expansion – geographic, vertical, or segment moves revealed through hiring, content, partnerships
- Competitive pressure response – reactive moves following your launches or competitor actions
Pattern recognition requires time-series analysis. A single snapshot can't reveal direction. You need historical depth to distinguish noise (random fluctuation) from signal (directional change). Three months of data shows movement. Twelve months separates tactics from strategy.
Latency: When Delayed Signals Cost You Position
Some signals matter only if you catch them early. A competitor's beta program for a feature that threatens your core value proposition gives you a six-month warning. Their general availability announcement gives you none. By the time the signal reaches you through public channels, the window to respond has closed.
Fast signals come from proximity to the source. If you rely on press releases and public blog posts, you're reading old intelligence. Capture signals closer to the decision:
- Job listings precede hiring announcements by weeks
- Support documentation updates precede feature launches
- Domain registrations and trademark filings precede brand expansions
- Infrastructure changes (new subdomains, API endpoints) precede product releases
Latency isn't just about speed. It's about decision advantage. The team that sees the pattern first chooses whether to preempt, follow, or ignore. The team that sees it last only reacts.

Engineering Signals for Machine Learning and Automation
Raw data signals aren't ML-ready. A price change registers as text on a webpage. Your model needs a numerical representation: percentage change, absolute difference, rate of change, position relative to competitive set. This transformation – raw signal to engineered feature – determines whether your intelligence system scales or drowns in manual review.
Vertex AI Feature Store and similar platforms solve this for production ML systems: transform raw signals into reusable, versioned features that models consume consistently. Competitive intelligence needs the same discipline. A pricing signal becomes a feature vector: price point, change magnitude, change velocity, percentile rank, time since last change.
Feature engineering for competitive signals includes:
- Temporal features – day-of-week effects, seasonality, time-since-last-event
- Relational features – position relative to competitive set (rank, percentile, distance from median)
- Velocity features – rate of change, acceleration, momentum indicators
- Categorical encoding – signal type, source reliability, entity classification
The goal is standardization. When every signal converts to a common format, you can train models to recognize patterns across signal types. A pricing change and a feature launch look different in raw form but share structural similarities when properly encoded.
Signal Quality and the Trust Problem
Not all signals carry equal reliability. A competitor's official blog post differs from an unverified review site claim. Your models need to weight signals by source authority, recency, and corroboration. This is the identity and measurement challenge familiar from advertising: how do you trust signals in a world where anyone can publish anything?
Build a trust model:
- Tier 1 sources – official channels (owned properties, SEC filings, verified partnerships)
- Tier 2 sources – credible third parties (industry analysts, established media, review platforms)
- Tier 3 sources – social and user-generated content (requires corroboration)
Single-source, uncorroborated signals from Tier 3 trigger monitoring, not action. Corroborated signals from Tier 1 and Tier 2 sources trigger strategic response. The system learns which sources predict actual moves vs. which generate noise.
Operationalizing Signals: From Detection to Decision
Detecting a signal means nothing if it doesn't reach the person who can act on it. Most intelligence dies in dashboards nobody checks or reports nobody reads. Operationalizing signals means routing them to decision-makers in the context where decisions happen: sales calls, product roadmaps, pricing reviews, marketing strategy sessions.
Signal routing by decision type:
| Decision Context |
Relevant Signals |
Delivery Method |
Latency Tolerance |
| Sales calls |
Competitive feature gaps, pricing changes, customer losses |
CRM integration, battlecards |
Hours |
| Product roadmap |
Feature releases, customer demand shifts, competitive gaps |
Weekly digest, planning docs |
Days |
| Pricing strategy |
Competitor price changes, packaging shifts, discount patterns |
Alert + monthly review |
Hours to weeks |
| Marketing positioning |
Messaging changes, audience shifts, campaign launches |
Bi-weekly brief |
Weeks |
Distributed tracing standards show how to propagate context across systems. Apply the same thinking to competitive intelligence: when a signal moves from detection to delivery, it carries context (entity, pattern, related signals, recommended action) that enables faster decisions.
Building Signal Workflows That Scale
Manual signal collection doesn't scale past a handful of competitors. You need systematic ingestion, automated filtering, and exception-based review. Humans intervene when signals exceed thresholds or break patterns, not to check every change.
The workflow architecture mirrors modern observability practices:
- Collection layer – ingest signals from all sources
- Processing layer – filter, deduplicate, enrich with context
- Storage layer – time-series database preserving signal history
- Analysis layer – pattern detection, anomaly identification
- Delivery layer – route relevant signals to appropriate decision-makers
BrandScout’s Competitor Discovery & Tracking solves this at the competitive intelligence level: systematic signal capture across your competitive landscape, automated pattern recognition, and delivery in the context of strategic frameworks. The platform transforms scattered market signals into structured intelligence that informs actual decisions.

Signal Decay and the Refresh Problem
Signals age. A competitor's pricing from six months ago tells you where they were, not where they are. Feature sets evolve. Positioning shifts. Market conditions change. Yesterday's intelligence becomes today's misinformation if you don't refresh it.
Signal decay rates vary by type:
- High decay (refresh daily) – pricing, promotions, inventory, ad spend
- Medium decay (refresh weekly) – feature sets, positioning, partnerships, content
- Low decay (refresh monthly) – team size, office locations, funding status, strategic direction
The refresh strategy depends on two factors: how fast the underlying reality changes and how much decision value stale data destroys. Outdated pricing loses you deals. Outdated team size is noise but doesn't actively mislead.
The Completeness vs. Freshness Tradeoff
You can have complete historical data or fresh current data, rarely both at scale. Complete coverage requires deep crawling, archival storage, and regular refresh of every signal from every competitor. That's expensive. Selective coverage focuses on high-value signals and competitors that matter most. That's practical.
Most teams solve this with tiered coverage:
- Tier 1 competitors (direct threats) – comprehensive signal coverage, daily refresh
- Tier 2 competitors (indirect threats, potential partners) – selective signal coverage, weekly refresh
- Tier 3 competitors (edge of market) – minimal coverage, event-triggered refresh
Refresh priorities shift with competitive dynamics. When a Tier 3 competitor raises significant funding or lands a major customer, they graduate to Tier 2 coverage. Your system adapts.
Building a Signals Discipline: Process Over Tools
Technology captures signals. Process converts them to intelligence. The difference is human judgment about what matters and why. Without disciplined review cycles, signal collection becomes data hoarding.
Establish review cadences tied to decision cycles:
- Daily standup – critical alerts, immediate threats, time-sensitive opportunities
- Weekly review – pattern updates, emerging trends, new competitors
- Monthly deep dive – strategic shifts, market structure changes, position reassessment
- Quarterly reset – refresh competitive set, revise signal priorities, validate patterns
These cycles create forcing functions. Signals that sit unreviewed for weeks aren't signals; they're noise you're storing. The review process separates teams that use intelligence from teams that collect it.
From Signals to Systematic Advantage
Data signals matter only in context. A competitor's pricing change means nothing in isolation. Combined with their hiring pattern, product updates, and messaging shifts, it reveals strategic direction. That combination enables prediction: where they're heading, what they'll do next, how to preempt or counter.
Building this capability requires infrastructure (collection, storage, processing), discipline (review cadences, decision routing), and strategic frameworks that convert patterns into plays. Tools capture the data. Frameworks like SWOT and Porter’s Five Forces turn it into strategy. The gap between raw signals and executed strategy determines who owns position in contested markets.
The companies that win don't collect more data signals than their competitors; they convert signals into decisions faster and more accurately. Brandscout builds that capability: systematic signal capture across your competitive landscape, automated pattern recognition, and strategic frameworks that convert intelligence into executable plays. Stop drowning in market noise. Start moving on what matters.
Competing Websites: Turn Market Signals into Strategy
Competing websites are not just traffic rivals. They are your most reliable source of market intelligence. Every feature they ship, every page they optimize, every message they test tells you something about customer demand, positioning choices, and market opportunity. The businesses that win treat competing websites as a structured intelligence problem, not a tracking problem. They build systems to capture signals, frameworks to interpret them, and discipline to act on what they learn. Most companies do the opposite: they bookmark a few competitor URLs, check them sporadically, and wonder why they're always reacting late.
Why Competing Websites Matter More Than You Think
Competing websites reveal strategy in motion. Pricing changes, content updates, feature launches, and design shifts are not random. They reflect resource allocation, customer feedback, positioning decisions, and market hypotheses. When you track competing websites systematically, you're reading your market's collective intelligence in real time.
The mistake most teams make is treating competitor websites as static benchmarks. They run a UX audit once a quarter or compare features when building a roadmap. That's useful, but it misses the movement. Competitive advantage comes from understanding the why behind the what. Why did a competitor add that feature now? Why did they rewrite their homepage copy? Why are they targeting that segment?
Signals competing websites send:
- Pricing adjustments indicate cost pressure, margin strategy, or market repositioning
- Feature releases reveal product roadmap priorities and customer pain points
- Content topics show where they believe demand is moving
- Design changes signal brand positioning shifts or conversion optimization efforts
- Partnership announcements suggest strategic alliances or ecosystem plays
Harvard Business School's breakdown of Porter’s Five Forces reminds us that rivalry intensity shapes every decision. Competing websites are the visible output of that rivalry. The more structured your intelligence collection, the clearer your strategic options become.
Building a System to Track Competing Websites
Ad hoc monitoring fails because it depends on memory and manual effort. You need a repeatable system that captures changes, organizes insights, and surfaces patterns without constant manual labor.
Start with Discovery
Most companies underestimate how many competing websites exist. You're not just tracking the three logos your sales team mentions. You're mapping direct competitors, indirect alternatives, emerging challengers, and niche specialists. BrandScout’s Competitor Discovery & Tracking solves this by using AI to surface every competitor in your category, including rising players you'd miss manually, and organizing them in a living database that updates as new intelligence arrives.
Discovery is not a one-time task. New competing websites launch, pivot, or expand into your space continuously. A proper system includes:
- Automated search monitoring for new entrants using category keywords
- Social listening to spot brands customers compare you to
- Funding and news tracking to identify well-capitalized challengers
- Customer interview insights about alternatives they evaluated
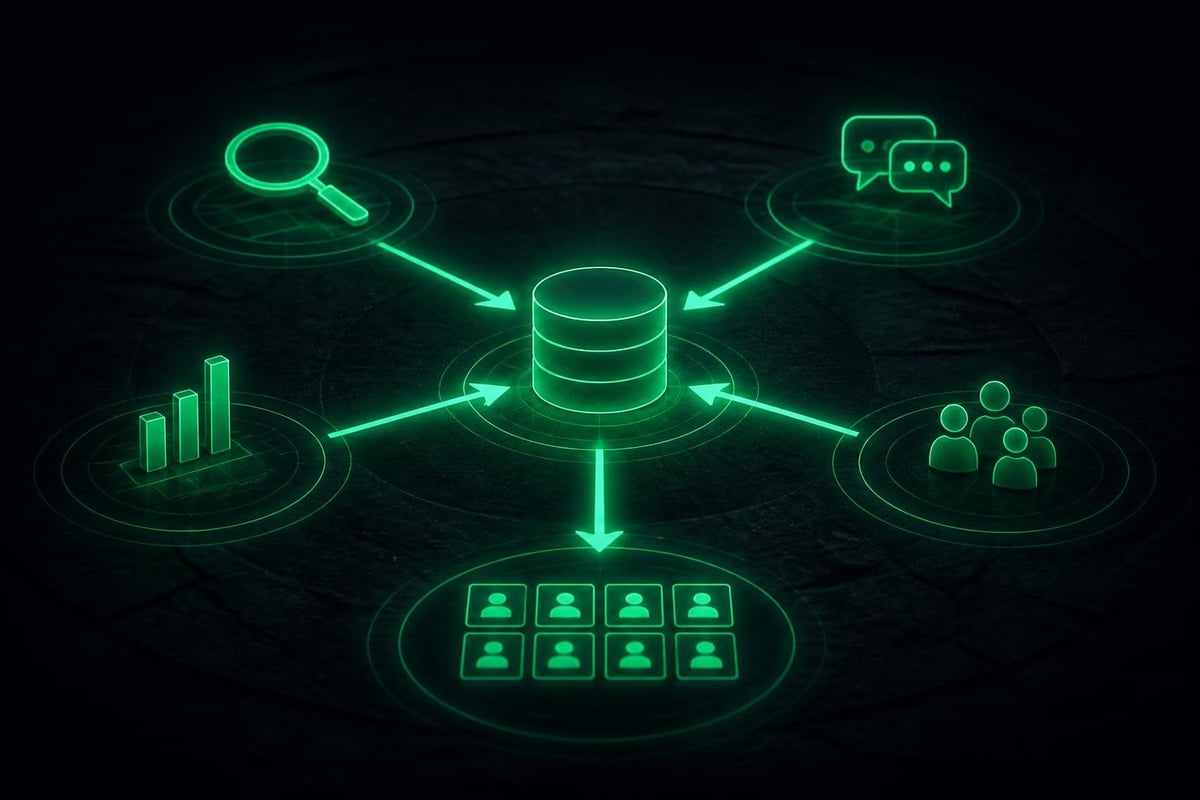
Organize Intelligence Around Strategic Questions
Raw data is not intelligence. You need structure. Group competing websites by segment, business model, or positioning. Tag features, messaging, pricing tiers, and market focus. The goal is to answer specific questions fast:
| Question |
What to Track |
| Who is moving up-market? |
Pricing changes, enterprise features, case study targets |
| Who is attacking our positioning? |
Homepage messaging, value props, differentiation claims |
| Who is winning SEO? |
Content volume, keyword rankings, backlink growth |
| Who is scaling fastest? |
Traffic estimates, hiring velocity, funding announcements |
Nielsen Norman Group's guide to competitive usability evaluations provides a practical UX-focused lens: track not just what competing websites do, but how users experience them. Usability, conversion flows, and accessibility choices all signal strategic priorities.
Automate the Repetitive Work
Manual competitor tracking burns time and delivers inconsistent results. Automate what you can:
- Website change alerts using tools like Visualping or custom scripts
- SEO monitoring through platforms that track keyword rankings and content gaps
- Social media tracking via listening tools that surface competitor mentions
- News and funding feeds aggregated in a single dashboard
Google's documentation on using Search Console to analyze content shows how to compare your performance against competing websites on organic search. Combine your data with theirs to identify content gaps and keyword opportunities.
Turning Intelligence into Strategy
Collecting data about competing websites is step one. Converting it into decisions is where most teams stall. You need frameworks that translate signals into strategic options.
Apply Proven Analytical Models
BrandScout's competitive intelligence platform automates frameworks like PESTEL, Porter's Five Forces, SWOT, and Ansoff against your real competitor data. These are not academic exercises. They are decision tools. Running them systematically against competing websites reveals:
- PESTEL: External forces (regulatory, economic, technological) shaping competitor moves
- Porter's Five Forces: Competitive intensity, supplier/buyer power, substitution risk
- SWOT: Where competitors are strong, vulnerable, or overextended
- Ansoff: Growth vectors competitors are pursuing (market penetration, development, diversification)
Forrester's Competitive Analysis Model offers an enterprise-grade structure for turning raw intelligence into strategic recommendations. The model emphasizes clarity: what you know, what it means, what you should do.
Defensive and Offensive Doctrines
Strategic doctrine gives structure to action. When analyzing competing websites, apply Jorge A. Vasconcellos e Sá's framework: eight defensive doctrines and six offensive strategies. These are fixed, proven options for responding to competitive moves.
Defensive doctrines help you protect position when competing websites attack:
- Position defense: Reinforce your current market stronghold
- Flanking defense: Protect vulnerable segments or geographies
- Preemptive defense: Strike before a competitor's threat materializes
- Counteroffensive defense: Respond to an attack by targeting the attacker's weakness
- Mobile defense: Expand into adjacent markets to avoid direct confrontation
- Contraction defense: Retreat from marginal positions to focus resources
- Fortification: Raise barriers (switching costs, ecosystem lock-in, network effects)
- Signaling: Communicate deterrence to prevent competitor moves
Offensive strategies help you seize opportunity when competing websites are vulnerable:
- Frontal attack: Direct challenge to a competitor's core position (requires resource advantage)
- Flanking attack: Target underserved segments or geographies
- Encirclement: Surround a competitor with multiple simultaneous moves
- Bypass attack: Leapfrog with new technology or business model
- Guerrilla warfare: Fast, targeted strikes where you have local advantage
- Alliance/co-opetition: Partner with competitors when mutual benefit exceeds rivalry
HubSpot's guide to website competitor analysis walks through the tactical layer: how to audit competing websites for UX, content, and conversion optimization. Combine that tactical lens with strategic doctrine to decide not just what to change, but why and when.

When to Collaborate Instead of Compete
Not every competing website is an enemy. Harvard Business Review's coverage of when collaborating with competitors makes sense explores co-opetition: situations where shared standards, joint lobbying, or ecosystem development benefit all players.
Co-opetition works when:
- The market is nascent and education/adoption is the bottleneck
- Regulation threatens and industry coordination improves outcomes
- Network effects require scale beyond what one player can achieve alone
- Technology standards benefit from interoperability
Competing websites in your space might be coalition partners on privacy standards, API interoperability, or regulatory advocacy. Track not just their moves against you, but their relationships with each other. Alliances shift competitive dynamics faster than product releases.
Common Mistakes When Analyzing Competing Websites
Even teams with good tracking systems make predictable errors. Avoid these:
Copying Without Understanding Context
Seeing a feature on a competitor's site and building it yourself is not strategy. You don't know if it worked, why they built it, or whether it fits your positioning. Context matters. A feature that makes sense for a freemium SaaS company may undermine a premium enterprise brand.
Before copying, ask:
- What problem is this feature solving for their customers?
- Does our customer base have the same problem?
- Does this reinforce or dilute our differentiation?
- Do we have the resources to execute it as well or better?
Ignoring Smaller, Faster Competitors
The biggest competing websites get the most attention, but the fastest-growing ones often matter more. Startups move faster, test more, and innovate without legacy constraints. Track the small players with momentum. They're often testing ideas the big players will adopt later.
Mistaking Activity for Strategy
A competitor launching features every week is not necessarily winning. High activity can signal experimentation, desperation, or poor focus. Look for patterns, not just volume. What themes connect their moves? Where are they concentrating resources?
Overlooking Legal and Regulatory Constraints
The FTC's guidance on anticompetitive practices and interoperability, privacy, and security reminds us that not all competitive moves are legal or sustainable. Aggressive tactics that work short-term can trigger regulatory scrutiny. Track not just what competing websites do, but whether it's defensible long-term.
Operationalizing Competitive Intelligence
Intelligence without execution is trivia. Build competitive insights into your operating rhythm.
Weekly Competitor Briefs
Assign ownership. One person (or team) summarizes meaningful changes from competing websites each week. Distribute it to leadership, product, and marketing. Keep it short: three to five bullet points with strategic implications, not a feature changelog.
Quarterly Deep Dives
Every quarter, pick one major competitor for deep analysis. Run full frameworks. Assess their strategy, vulnerabilities, and likely next moves. Update your positioning and roadmap based on what you learn.
Integrate into Decision Processes
When evaluating a new feature, market expansion, or pricing change, include a competitor impact assessment. What will this enable or prevent? How will competing websites respond? Are we prepared for their countermove?
BrandScout's approach to competitive intelligence emphasizes turning scattered signals into structured intelligence that feeds directly into strategic planning. The platform connects discovery, analysis, and execution in one workflow, so insights don't sit in decks-they drive decisions.

Metrics That Matter When Tracking Competing Websites
Not all metrics are equally useful. Focus on the ones that reveal strategic intent and market position.
Market Position Indicators
| Metric |
What It Reveals |
| Traffic growth rate |
Momentum and market penetration |
| Customer acquisition cost trends |
Efficiency and profitability |
| Feature release velocity |
R&D investment and product ambition |
| Pricing changes |
Margin pressure or repositioning |
| Content volume and topics |
SEO strategy and thought leadership focus |
Positioning and Messaging Shifts
Track homepage value propositions, taglines, and case study targets over time. Changes signal repositioning, segment pivots, or competitive response. Archive competitor pages quarterly using Wayback Machine or screenshots. Compare messaging evolution to understand strategic direction.
Ecosystem and Partnership Moves
Integration announcements, marketplace listings, and partnership press releases reveal ecosystem strategy. Competing websites that build strong partner networks create defensible moats. Track not just their direct capabilities, but their extended reach through integrations.
The Intelligence Advantage
Competing websites are not obstacles. They are intelligence assets. The businesses that treat them as such-systematically capturing signals, applying strategic frameworks, and operationalizing insights-move faster and decide better than those who track ad hoc.
Your competitors are already analyzing you. The question is whether you're analyzing them with equal discipline. Structure beats effort. Frameworks beat intuition. Systems beat heroics.
The market rewards the teams that turn competitor moves into strategic clarity, not the ones with the longest spreadsheet of tracked URLs. Intelligence is only valuable when it changes what you do.
Competing websites reveal your market's collective intelligence in real time, but only if you have the system to capture, interpret, and act on what they're telling you. BrandScout transforms scattered competitor signals into structured intelligence, applying proven frameworks like Porter's Five Forces and SWOT to generate actionable strategies and 90-day plans grounded in your real competitive landscape. Stop tracking and start deciding.
Data Decisions: When Competitive Intelligence Counts
Most executives drown in data they barely trust. Dashboards multiply, reports stack up, yet the essential call – which competitor to confront, which market gap to exploit – hangs in paralysis. Data decisions separate winning organizations from those buried under information. The difference isn't access to more data. It's the system that converts signals into a decision you can execute Monday morning. In 2026, market intelligence platforms either solve this translation problem or they become part of the noise.
Why Most Data Decisions Fail Before They Start
Organizations collect obsessively and decide poorly. The root cause isn't bad data quality or insufficient volume. It's the gap between measurement and meaning.
You track twenty competitors. You monitor pricing changes, feature releases, funding announcements, customer reviews. The signals arrive daily. Now what? Most teams stop at visibility. They've built a watch system without a doctrine for what action each signal should trigger. So data piles up, and decisions default to whoever argues loudest in the room.
The Three Failure Modes
Measurement theater – tracking metrics because they're trackable, not because they drive action. Competitor website traffic, social follower counts, press mention volume. Interesting. Irrelevant to the decision you're avoiding: should we match their pricing or defend on differentiation?
Analysis paralysis – running every framework in the toolkit, producing reports no one implements. SWOT becomes a quarterly ritual. Porter's Five Forces lives in a slide deck. Where data-driven decision-making can go wrong tracks this pattern across industries: organizations mistake analytical activity for strategic progress.
Institutional bias – using data selectively to confirm what leadership already believes. Competitive intelligence becomes evidence collection for predetermined conclusions. The signals that contradict the current plan get filtered out before they reach decision-makers.

What Makes a Data Decision Actually Defensible
A defensible data decision has three attributes: it's falsifiable, traceable, and doctrine-grounded.
Falsifiable means you've defined conditions under which you'd choose differently. "We're entering this segment because competitor X is under-investing there" only works if you'd abandon entry when X pivots investment. If you're entering regardless, don't pretend data drove it.
Traceable means someone reviewing your decision six months later can reconstruct your logic from the intelligence you had. Which competitor signals mattered? Which you discarded and why? This isn't cover-your-ass documentation. It's the feedback loop that makes your next data decision smarter.
Doctrine-grounded means the decision maps to a strategic principle you can name. Defensive doctrines – position defense, mobile defense, strategic withdrawal, counter-offense – give structure to competitive responses. Offensive doctrines – frontal attack, flanking, encirclement, bypass – organize market entry moves. When a competitor launches adjacent to your core, doctrine tells you whether to extend your defensive line or concentrate force and let the periphery go.
The Structured Intelligence Standard
Intelligence only becomes actionable when it's structured around decisions you actually face. Raw signals – a competitor raises Series B, another deprecates a feature, a third hires a VP from your industry – mean nothing in isolation.
| Signal Type |
Strategic Question |
Decision Enabled |
| Funding event |
Are they preparing offensive expansion or solving burn? |
Resource allocation timing |
| Feature deprecation |
Retreat from segment or pivot to premium? |
Competitive positioning |
| Executive hire |
Capability build or symbolic acquisition? |
Threat timeline assessment |
This isn't a call to ignore qualitative judgment. It's recognizing that judgment improves when applied to structured input rather than scattered impressions. Competitive intelligence as a discipline exists to create that structure.
From Signals to Strategy: The Translation Layer
The hardest part of data decisions isn't collection. It's translation – converting what you observe into what you should do.
Most platforms stop at dashboards. They surface changes, highlight anomalies, track trends. Then they hand you the strategic question: so what? The translation burden falls entirely on you. For a single-brand founder or growth lead, that's a weekly tax on cognitive bandwidth. For agencies and multi-brand teams, it's repetitive work that scales badly.
Frameworks as Translation Infrastructure
Strategic frameworks – PESTEL, Porter's Five Forces, SWOT, Ansoff – exist to automate part of this translation. They're not theoretical exercises. They're structured prompts that force you to convert observations into implications.
- PESTEL asks which macro forces (political, economic, social, technological, environmental, legal) turn competitor moves into threats or opportunities for you
- Porter's Five Forces translates industry signals into competitive intensity and profit potential
- SWOT organizes internal capabilities and external conditions into a decision matrix
- Ansoff converts market and product signals into growth direction choices
The value isn't running these once in a strategy off-site. It's applying them systematically every time significant intelligence arrives, so your data decisions benefit from cumulative pattern recognition rather than starting fresh each quarter.
BrandScout's Competitive Analysis & Strategy runs these frameworks automatically against your live competitive data, then uses HORIZON AI to generate specific attack and defense strategies with a 90-day execution plan. It solves the "I have competitor intelligence but don't know what to do with it" problem by ending in a play, not a report.

When Organizational Design Undermines Data Decisions
You can have perfect intelligence and still make bad calls if the organization isn't built to use it. Organizational factors that enable or impede data-informed decisions include analytical culture, centralization versus decentralization, and the gap between insight generation and decision authority.
The Centralization Trade-Off
Centralized competitive intelligence – one team gathering signals for the whole organization – creates consistency but delays local response. A regional sales lead spots a competitor discount pattern in their territory. By the time it's validated centrally and approved for countermeasure, the window's closed.
Decentralized intelligence – every function tracking competitors independently – accelerates response but fragments understanding. Marketing sees one competitor set, sales another, product a third. No one has the complete picture.
The effective middle ground: centralized infrastructure, decentralized interpretation. One system captures all signals. Multiple teams apply doctrine to their domain. Regional sales uses the same competitive data as product, but each translates it through their lens: pricing response versus feature roadmap adjustment.
Culture Eats Dashboards
A dashboard showing competitor moves means nothing if leadership punishes bearers of bad news. If the organizational norm is "we're winning, don't surface threats," your competitive intelligence becomes a parade of false positives and missed warnings.
Data decisions require a culture that rewards early warning over comfortable confirmation. The intelligence team's job isn't to make leadership feel good about their position. It's to surface the move that threatens that position while there's still time to respond. Organizations that shoot that messenger end up making data decisions based on stale assumptions and wishful projections.
The Equity and Governance Dimension
Data decisions carry embedded assumptions about whose perspective matters and whose gets filtered out. Frameworks for data equity push organizations to examine whether their intelligence gathering privileges certain signals and silences others.
In competitive intelligence, this shows up in which competitors you track and which you ignore. Focusing only on funded startups and public companies means you miss bootstrapped challengers and regional specialists. Monitoring only English-language signals means you're blind to competitors building in other markets until they're at your door.
Data Stewardship Standards
NIST’s Research Data Framework addresses governance and lifecycle management for data used in decisions. While built for research contexts, the principles apply: data decisions are only as trustworthy as the provenance, handling, and validation processes behind them.
For competitive intelligence, this means:
- Source documentation – where did each signal originate, when was it captured, how was it verified?
- Update cadence – how often is each data point refreshed, and what's the lag between real-world change and your awareness?
- Conflict resolution – when sources disagree (two estimates of competitor revenue, for example), what's your tiebreaker?
This isn't bureaucratic overhead. It's the foundation that lets you make a data decision today and defend it tomorrow when the outcome becomes clear.
Building Your Data Decision System
The system that turns intelligence into action has five components. Most organizations have three, wonder why decisions still feel arbitrary.
Component Breakdown
| Component |
What It Does |
Common Gap |
| Collection |
Gathers competitor and market signals |
Scattered across tools, incomplete |
| Structure |
Organizes signals into comparable categories |
Manual tagging, inconsistent taxonomy |
| Analysis |
Applies frameworks to generate implications |
One-off reports, no cumulative learning |
| Doctrine |
Maps implications to strategic options |
Missing entirely or ad hoc |
| Execution |
Converts option into plan with owners and timeline |
Stops at recommendation, no follow-through |
Most platforms solve collection, maybe structure. BrandScout connects all five – discovery through execution – because a data decision isn't complete until someone owns the next ninety days.
The Update Loop
Your competitive landscape changes faster than your quarterly planning cycle. A functional data decision system updates continuously, flags threshold changes, and prompts reconsideration when assumptions break.
Set tripwires: "If competitor A enters market segment B, we revisit our resource allocation within two weeks." When the signal arrives, the decision process triggers automatically. You're not scrambling to interpret what it means; you've already defined the decision tree.
This is how effective battlecards work in sales. The competitive response isn't improvised in the moment. It's pre-loaded based on structured intelligence, activated when the scenario appears.
Deciding Under Uncertainty Versus Deciding Without Information
Data decisions never have perfect information. The question is whether you're deciding under uncertainty – you've gathered available signals, assessed reliability, and defined your confidence level – or ignorance – you're guessing because you haven't built the intelligence system.
Uncertainty you can quantify. "We estimate competitor X has twelve-month runway based on last funding round and burn rate signals, confidence medium." That's a data decision. You might be wrong, but you've structured your reasoning and can update it.
Ignorance looks like: "We think they're probably fine financially?" No data decision happened. You're moving on vibes.
Confidence Calibration
Track your data decisions and outcomes. Did the competitor you predicted would retreat actually withdraw? Did the market gap you entered based on intelligence analysis turn out undefended? Over time, you'll see which signal types and analytical approaches yield reliable decisions versus noise.
Most organizations never close this loop. They make a competitive call, move on, and never score whether their intelligence held up. That's how you repeat the same interpretive errors for years. Calibrate your confidence by tracking your hit rate, and your data decisions compound in accuracy rather than cycling through the same blind spots.
What Good Looks Like in Practice
A well-executed data decision leaves a clean trail: the signal that prompted review, the analysis conducted, the doctrine applied, the option selected, the plan built, the owner assigned. Six months later, anyone should be able to reconstruct your logic and evaluate whether the intelligence matched reality.
Bad data decisions are untraceable. "We decided to enter this segment" – based on what signals? Analyzed how? Why this approach versus alternatives? The answers are in someone's head, lost when they leave, unavailable for institutional learning.

The competitive intelligence advantage isn't secret data. It's the system that makes reliable data decisions repeatable. Build structure around signal interpretation. Ground choices in doctrine. Document your reasoning. Track outcomes. Each cycle makes the next data decision faster and more defensible. That's how market intelligence becomes a capability, not a cost center hoping to justify headcount.
Data decisions convert competitive signals into strategic action – but only when you've built the infrastructure that connects observation to execution. Most organizations stop at dashboards and wonder why clarity never arrives. Brandscout closes that gap by running proven frameworks against live competitive intelligence, generating doctrine-grounded strategies with execution plans your team can implement immediately. Turn market signals into decisions you can defend.