BI Market Share: 2026 Vendor Rankings and Strategic Shifts
The business intelligence market doesn't hand you a clean scoreboard. Vendor rankings shift constantly, driven by cloud migrations, AI integration, and changing buyer priorities. Understanding bi market share means reading between revenue figures to spot which vendors are gaining ground, which are losing momentum, and why those movements matter for your own strategic decisions. The landscape changed dramatically between 2023 and 2026, with several established players surrendering position while upstarts claimed territory in specific segments.
The Current BI Market Share Landscape
The global business intelligence software market reached $29.4 billion in 2026, according to Statista’s Business Intelligence Software Outlook. That figure represents 14.2% year-over-year growth, but the distribution across vendors tells a more complicated story than aggregate expansion suggests.
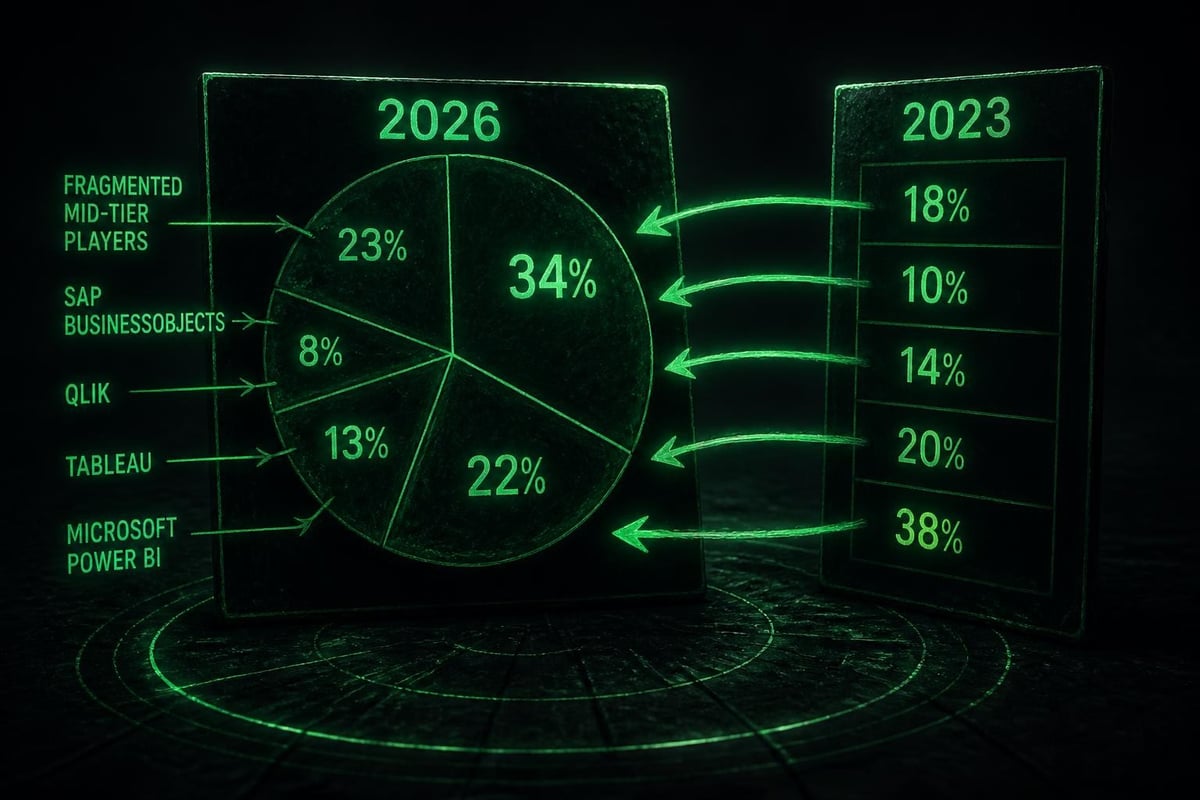
Microsoft Power BI holds the largest slice of bi market share at approximately 22.3%, a position it claimed in late 2024 and has defended through aggressive bundling with Microsoft 365 and Azure. Tableau (Salesforce) commands roughly 16.1%, down from 18.7% in 2023. The erosion isn't dramatic, but the direction matters. Qlik maintains 11.4%, while SAP BusinessObjects sits at 9.2%. The remaining vendors fragment into single-digit shares, with several clustered between 3-6%.
These percentages shift depending on whether you measure by revenue, user seats, or deployment instances. Statista’s vendor market-share data tracks revenue-based rankings, which favor enterprise deals over high-volume, low-cost deployments. A vendor with 50,000 small-business customers at $20/month ranks below one with 200 enterprise accounts at $500,000 annually, even if the former touches more users and generates more daily queries.
The Drivers Behind Market Share Movements
Three forces reshuffled bi market share between 2023 and 2026: cloud migration acceleration, embedded analytics adoption, and AI-powered automation.
Cloud migration hit critical mass in 2024. Enterprises that delayed through 2022-2023 finally committed, and that decision drove vendor selection. Legacy on-premise BI platforms lost ground to cloud-native or cloud-first alternatives. Microsoft's Azure integration gave Power BI an unfair advantage; companies already running Azure infrastructure faced minimal friction adding Power BI. SAP BusinessObjects and older IBM Cognos deployments bled accounts to vendors offering smoother cloud transitions.
Embedded analytics changed buying patterns. Instead of purchasing standalone BI platforms, companies increasingly demanded analytics capabilities built directly into their operational software (CRM, ERP, supply chain systems). This shift fragmented the market. SaaS vendors with adequate resources built proprietary BI rather than licensing third-party platforms. Salesforce embedding Tableau into its own products illustrates the pattern: it protected Tableau's enterprise footprint but capped expansion into other ecosystems.
AI automation arrived faster than most vendors anticipated. BARC’s BI Trend Monitor 2025 identified "AI-augmented analytics" as the top priority for 67% of surveyed organizations. Vendors that shipped natural-language querying, automated insight generation, and predictive modeling gained momentum. Those treating AI as a roadmap item rather than a shipping feature lost accounts to competitors who delivered immediately.
How Financial Services Reshaped BI Demand
Financial services institutions represent roughly 19% of total BI spend, making them the single largest vertical influence on bi market share. Their requirements differ sharply from other industries, and vendors that failed to adapt lost ground in this lucrative segment.
| Requirement | Why It Matters | Vendor Impact |
|---|---|---|
| Real-time data latency | Trading, risk models, fraud detection demand sub-second refresh | Penalized vendors relying on batch processing |
| Regulatory compliance | SOX, MiFID II, GDPR audit trails required | Favored platforms with built-in lineage tracking |
| Multi-source integration | Banks use 200+ data sources on average | Rewarded vendors with broad connector libraries |
| Role-based security | Strict separation between analyst, trader, compliance roles | Eliminated vendors with coarse access controls |
Deloitte’s analysis of data analytics in investment banking highlights how these institutions demand governance features most vendors treat as enterprise add-ons. The gap between standard BI platforms and financial-services-grade requirements created an opening for niche specialists. Some gained enough traction in this vertical to claim 2-3 points of overall bi market share despite narrow industry focus.
The regulatory dimension matters more than most vendors acknowledge. Financial institutions can't adopt BI platforms that lack comprehensive audit trails, version control for reports, and certification workflows. A platform might excel at visualization and query performance but remain undeployable in banking if it can't prove which data fed which executive dashboard on which date. Vendors that treated compliance as checkbox documentation rather than core architecture lost renewals when auditors flagged gaps.
The Embedded Analytics Dilemma
Embedded analytics undermined traditional bi market share calculations. When Salesforce, ServiceNow, and Workday build analytics directly into their platforms, do those capabilities count as BI market share? Most market researchers exclude them, but from a buyer's perspective, embedded analytics directly substitutes for standalone BI in many use cases.
This creates a measurement problem. A company running Salesforce with embedded Tableau dashboards technically contributes to Tableau's market share, but if Salesforce bundled those capabilities at no incremental cost, did Tableau actually capture that revenue? The accounting gets messy. Some organizations "use" three or four BI platforms simultaneously: one embedded in their CRM, another in their ERP, a third for finance, and a fourth for executive reporting. Asking "what's your BI platform?" produces answers that don't aggregate cleanly into market-share percentages.
The strategic implication: bi market share numbers understate fragmentation. The market looks more concentrated than it actually is because measurement methodologies ignore the 30-40% of analytics workloads now running on embedded platforms that don't appear in traditional BI vendor rankings.
Cloud-Native vs. Cloud-Adapted: Why Architecture Determines Share
The split between cloud-native and cloud-adapted architecture explains most of the bi market share gains and losses since 2023. Cloud-native platforms (built for cloud infrastructure from the start) outperformed cloud-adapted platforms (on-premise products retrofitted with cloud deployment options).
Looker (Google Cloud) exemplifies cloud-native advantages. Its data modeling layer assumes cloud storage, compute elasticity, and API-first integration. The platform scales horizontally without architectural gymnastics. Domo followed similar principles. Both gained share in segments where buyers prioritized cloud-first design over feature breadth.
Cloud-adapted platforms struggled with technical debt. Migrating a codebase designed for on-premise deployment introduces compromises. Query optimization techniques that worked brilliantly on local databases perform poorly against cloud data warehouses. Security models built for network perimeters don't translate cleanly to cloud identity management. Vendors that rushed cloud versions to market shipped products that technically ran in the cloud but didn't exploit cloud advantages.

This architectural divide created a trap for market leaders. Vendors with large on-premise install bases faced a choice: invest heavily in cloud-native rebuilds (abandoning existing customers on older versions) or incrementally adapt existing products (shipping inferior cloud experiences). Most chose incremental adaptation to protect revenue, which opened the door for upstarts with nothing to protect and everything to gain.
The Organizational Factors That Override Technical Merit
Technical superiority doesn't guarantee bi market share gains. Harvard Business Review’s research on data-driven decision-making identifies organizational and cultural factors that often matter more than platform capabilities. Companies select BI vendors based on:
- Existing technology relationships (Microsoft shops buy Power BI regardless of alternatives)
- Internal skill availability (platforms requiring scarce expertise lose to those matching current team capabilities)
- Executive sponsorship (a CTO's preference outweighs feature comparisons)
- Change fatigue (organizations recently completing other migrations avoid BI platform switches)
These non-technical factors entrench market leaders. Once a vendor achieves 15-20% market share, organizational inertia works in their favor. Buyers default to "safe" choices even when better alternatives exist. Displacing an incumbent requires not just superior technology but overwhelming superiority – enough to justify migration costs, retraining, and political battles with stakeholders invested in the status quo.
Competitive Intelligence Platforms and BI Market Share Data
Understanding bi market share movements matters for competitive intelligence teams tracking market dynamics. Platforms like BrandScout help organizations map competitive landscapes and identify strategic shifts before they become obvious. When a BI vendor's market share drops two percentage points over six quarters, that signal indicates vulnerability worth investigating.
BI vendor selection itself requires competitive analysis. A company choosing between Power BI, Tableau, and Qlik needs to evaluate not just current features but strategic direction, investment priorities, and ecosystem momentum. BrandScout's Competitive Analysis & Strategy offering runs frameworks like Porter's Five Forces and SWOT automatically, then generates attack and defense strategies grounded in real competitive data – the same analytical approach that helps decode why certain BI vendors gain ground while others stagnate.
Reading bi market share shifts means looking past headline percentages to understand why buyers chose one vendor over another. Was it price, features, integration, support, or something unrelated to the product itself? Research on BI visualization requirements shows that user experience factors – specifically, how easily non-technical users can build their own reports – increasingly drive vendor selection. A platform might have superior query optimization but lose deals because business users can't navigate its interface without SQL knowledge.
Regional Variations in BI Market Share
Global bi market share figures mask dramatic regional differences. North American rankings don't predict European or Asia-Pacific patterns. Microsoft Power BI dominates North America (26.4% share) but holds only 14.1% in Asia-Pacific, where local vendors and different buying preferences reshape the landscape.
Europe shows stronger preference for governance-heavy platforms. GDPR requirements and data-residency regulations favor vendors with robust data-lineage features and regional cloud infrastructure. SAP BusinessObjects maintains higher European market share (13.7%) than its global average (9.2%) because European enterprises already running SAP ERP find integrated BI adoption frictionless.
Asia-Pacific fragmentation reflects diverse market maturity. Japan's BI market skews toward local vendors (Wingarc, Cybozu) that Western share calculations ignore. China's market operates almost independently, with vendors like FineReport and Smartbi claiming meaningful share that never appears in global rankings. India shows rapid cloud adoption favoring low-cost, self-service platforms over enterprise suites.
Multinational companies operating across regions face a dilemma: deploy a single BI platform globally (simplifying governance but compromising regional fit) or allow regional variation (optimizing local needs but complicating central oversight). This decision influences which vendors gain share in different geographies.
The 2026-2028 Outlook for BI Market Share
Three developments will reshape bi market share through 2028: generative AI integration, data mesh architecture adoption, and vertical-specific platform growth.
Generative AI moves beyond natural-language querying into report generation, anomaly explanation, and automated insight delivery. Vendors shipping robust LLM integration will capture share from those treating AI as a future project. The gap between leaders and laggards on this dimension will widen rapidly because AI capabilities compound – each improvement enables the next, while platforms without foundation struggle to catch up.
Data mesh architecture challenges centralized BI assumptions. Instead of consolidating all data into a single warehouse for BI tools to query, data mesh distributes ownership to domain teams who publish data products. This shift favors BI platforms that integrate cleanly with federated data architectures over those requiring central data consolidation. Vendors invested in traditional ETL/ELT patterns face strategic risk if data mesh adoption accelerates.
Vertical-specific BI platforms will chip away at general-purpose vendor share. Healthcare BI platforms that understand FHIR standards, claims data, and clinical workflows outperform generic tools customized for healthcare. Similarly, retail, manufacturing, and logistics see specialized platforms gaining traction. This trend fragments the market, making bi market share leadership harder to defend because dominance in one vertical doesn't transfer to others.

What Market Share Actually Reveals
Bi market share percentages tell you which vendors won the most deals, but not why those deals closed or whether buyers made the right choice. A vendor can gain share by aggressive discounting, bundling with unrelated products, or superior sales execution despite mediocre technology. Conversely, smaller vendors with superior platforms sometimes lose deals to marketing budgets and brand recognition.
The strategic lesson: treat market share as one signal among many, not as validation. When evaluating BI vendors, investigate:
- Share trend direction (gaining or losing over 8-12 quarters)
- Segment-specific performance (enterprise vs. mid-market vs. small business)
- Customer retention rates (high churn despite market share growth signals dissatisfaction)
- Product investment (R&D spend as percentage of revenue indicates commitment)
- Ecosystem health (third-party integrations, community size, partner network)
A vendor with 8% market share but 95% retention and accelerating growth in your specific industry might be a better choice than the 20% market leader with 78% retention and stagnating innovation. Market share provides context, not answers. Understanding how to build effective battlecards helps sales teams translate competitive intelligence like BI market share into persuasive positioning that addresses real buyer concerns rather than abstract rankings.
The Acquisition Impact on BI Market Share
Acquisitions reshuffled bi market share more dramatically than organic growth over the past three years. Salesforce acquiring Tableau (completed 2019, but integration effects peaked 2024-2025) initially protected Tableau's share by providing Salesforce's distribution muscle, but then cannibalized growth as Salesforce pushed embedded analytics over standalone deployments.
Google's Looker acquisition (2019) followed a different pattern. Google invested in Looker's semantic modeling layer, positioning it as the analytics frontend for BigQuery. This strategy grew Looker's share within Google Cloud accounts but limited expansion into AWS and Azure environments. The trade-off: deeper integration with one cloud provider versus broader multi-cloud appeal.
Private equity consolidation reshaped the mid-market. PE firms acquired several BI vendors between 2023-2025, merged their customer bases, and eliminated redundant products. These moves consolidated fragmented mid-market share but often degraded product quality as engineering teams integrated disparate codebases. Some customers fled to pure-play vendors, redistributing share again.
The acquisition lesson: market share shifts lag strategy changes by 12-18 months. When a vendor gets acquired, their reported share often stays stable or even grows initially, before erosion sets in as the acquirer's strategic priorities reshape product roadmaps. Watching acquisition patterns helps predict future bi market share movements before they show up in revenue reports.
BI market share data reveals competitive movements, but translating those signals into strategic decisions requires deeper analysis than headline percentages provide. The vendors gaining ground in 2026 succeeded by aligning product architecture with buyer priorities (cloud-native design, AI integration, vertical specialization) while those losing share clung to approaches that worked in previous market conditions. BrandScout transforms scattered market signals like vendor rankings, technology shifts, and buyer preference changes into structured intelligence that clarifies competitive positioning and informs strategic execution.